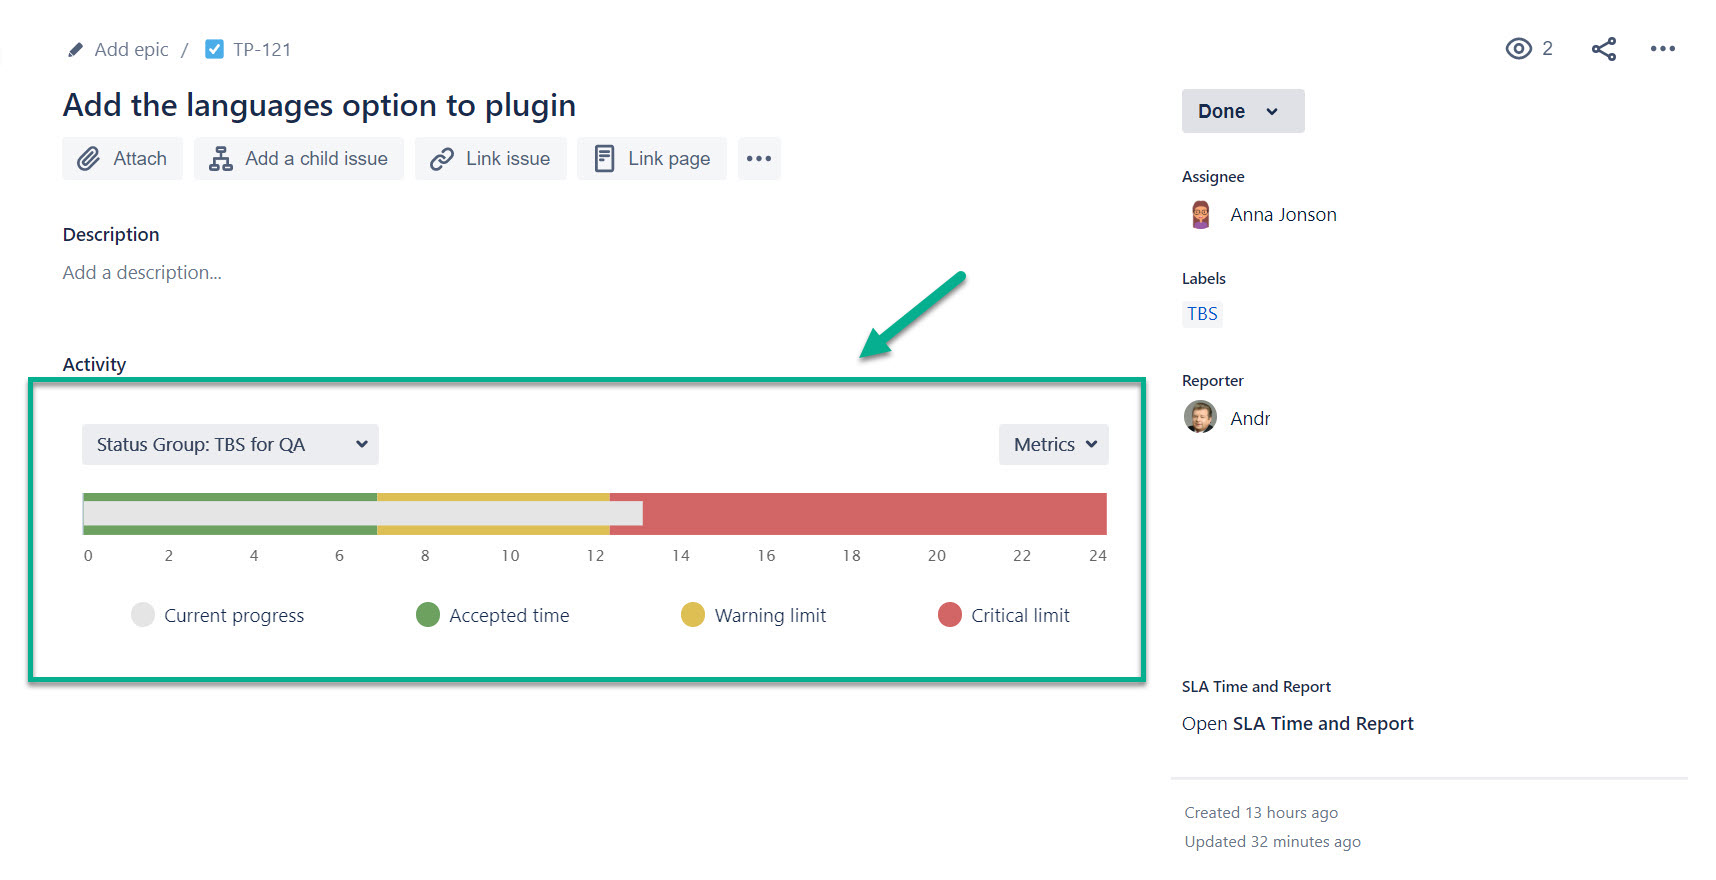
Users of app Time Between Statuses can monitor status to status duration data about each ticket in each issue view tab
Just choose Time Between Statuses option in the Activity drop-down menu. And get both graphical and numerical data at the single issue view panel.
The white line represents current progress - the issue movement with respect to time limits. And the color segments are the time intervals the task passes through: green - accepted time, yellow - warning time and red - critical limit.
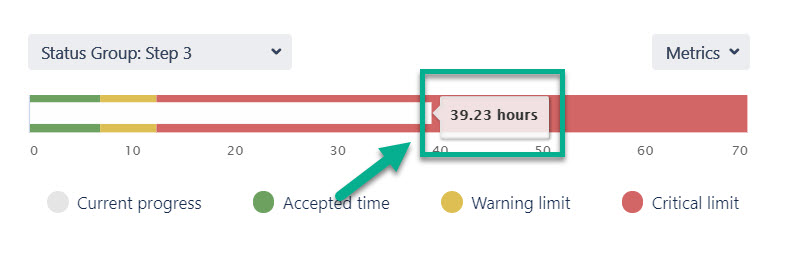
To get detail numerical data click on the white line.
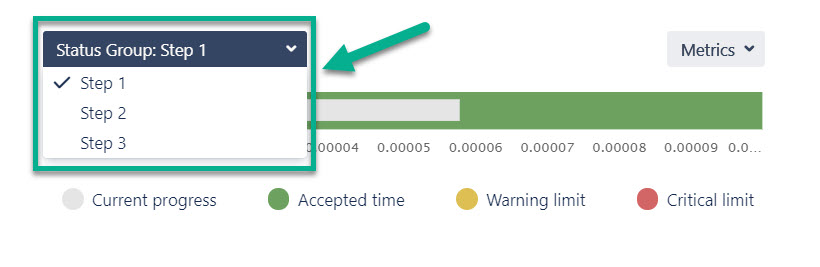
In the issue view tab users can choose one of the status groups created before in the app’s configuration manager.
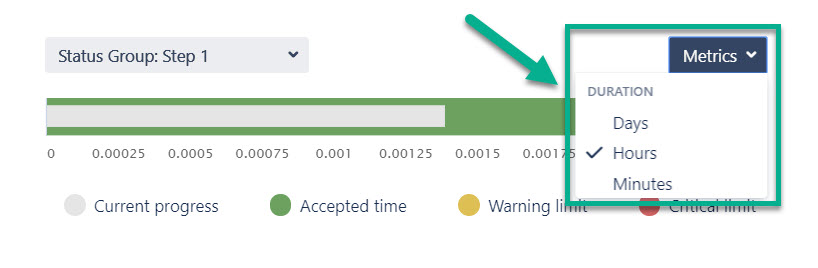
Also, there is the available drop-down menu for selection kind of metrics (days, hours or minutes).
If you need help or want to ask questions, please contact us through a SaaSJet Support or via email support@saasjet.atlassian.net
Haven't used this add-on yet, then try it now! >>>