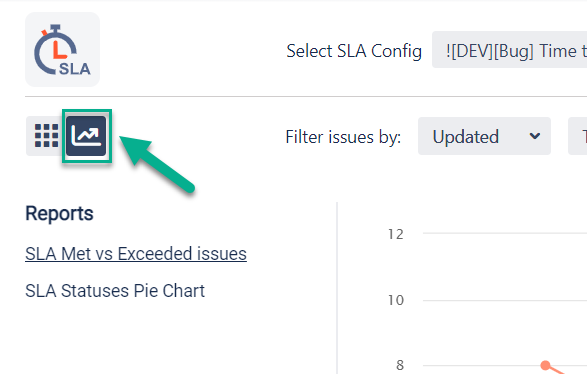
You can get a helicopter view of necessary issues’ SLA statuses using graph reports at SLA Time and Reports. Just click the icon at the left top bar.
You can view data by using 3 kinds of chart views:
Pie Chart (SLA Met/In Progress/Exceeded)
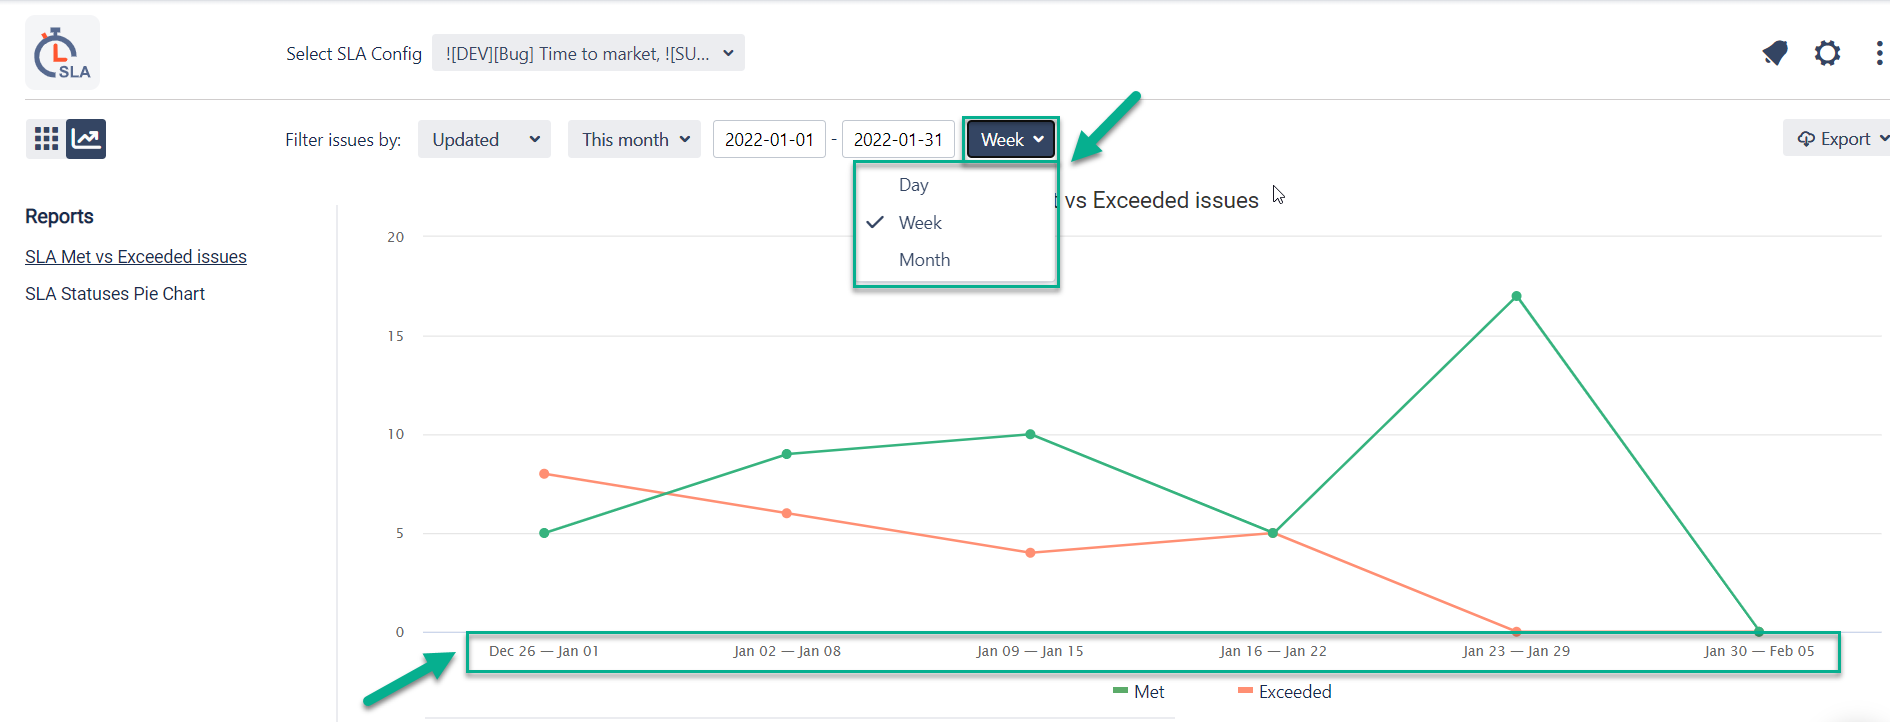
Line Graphs (SLA Met & Exceeded)
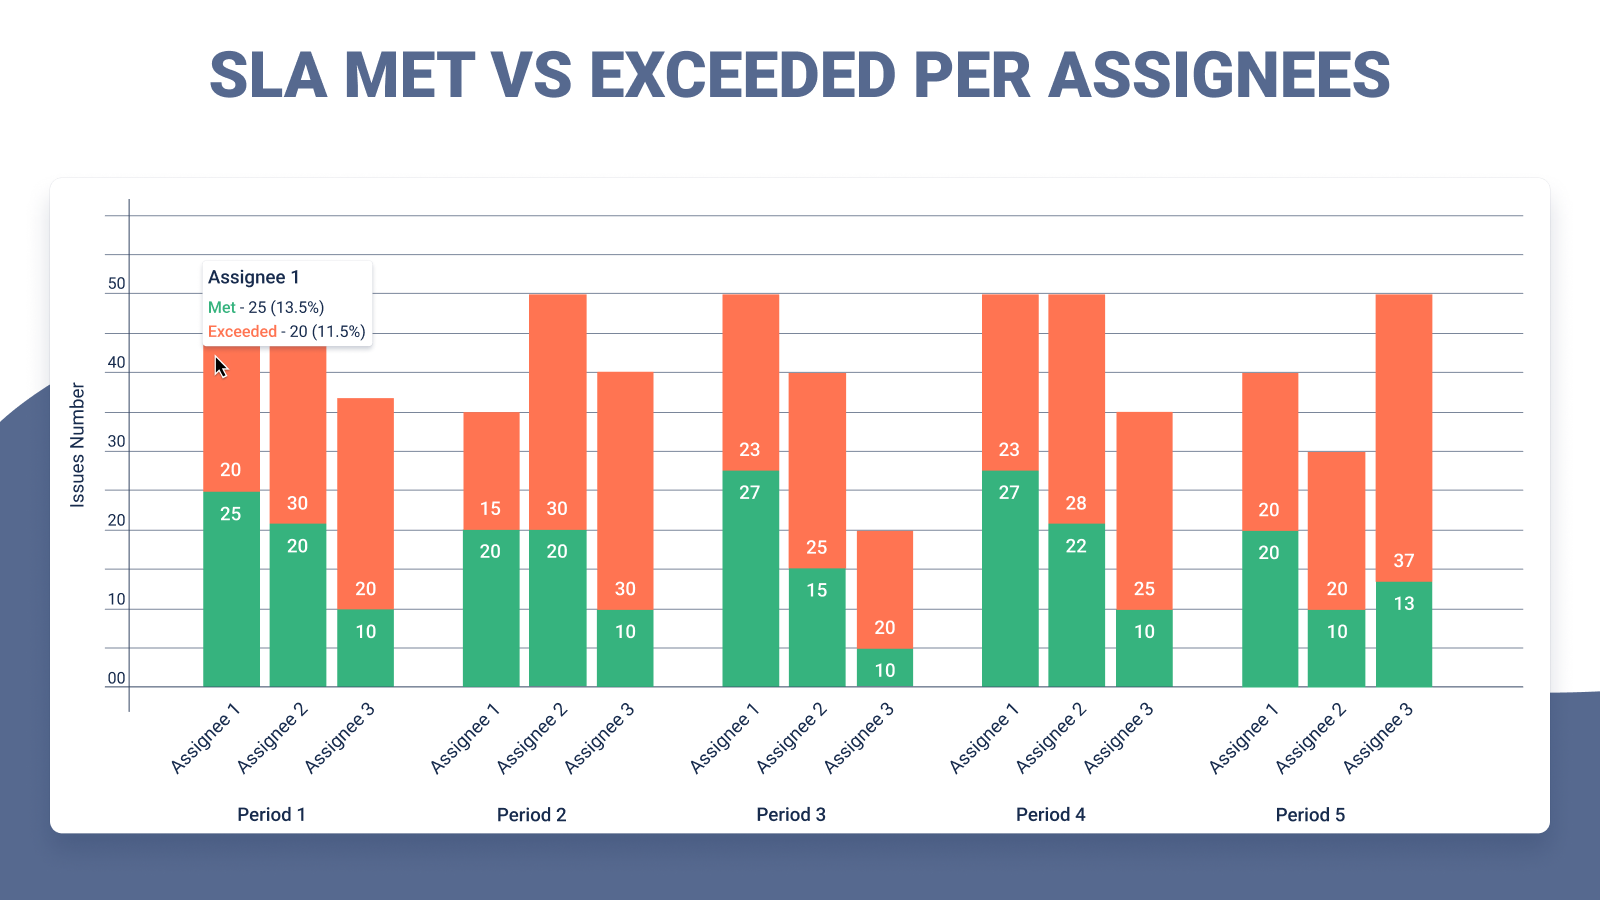
SLA Met vs Exceeded per Assignee
SLA Met & Exceeded issues
Line Graph of SLA Met & Exceeded issues - shows dynamic and statistic data of met and exceeded issues for SLA config’s goals.
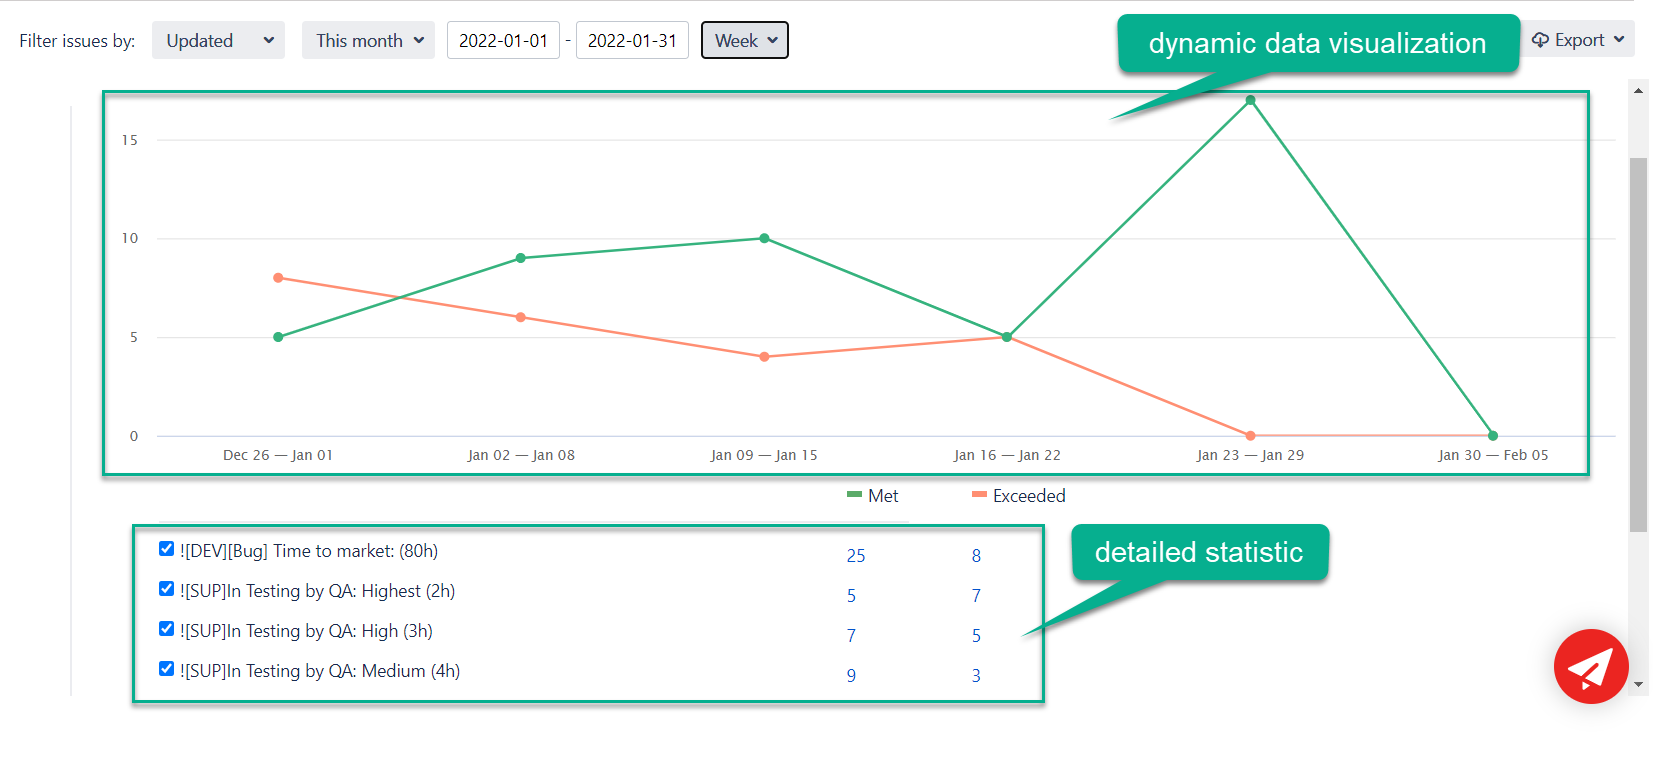
Under the chart, you can see the detailed information about the number of issues with met and exceeded SLA goals. Also, you can exclude SLA goals to view chart data without them and contra versa. If SLA Config has more than one SLA goals, the data will be displayed about each one.
For this type of report you can select the frequency of splitting data on the chart: daily, weekly, monthly.
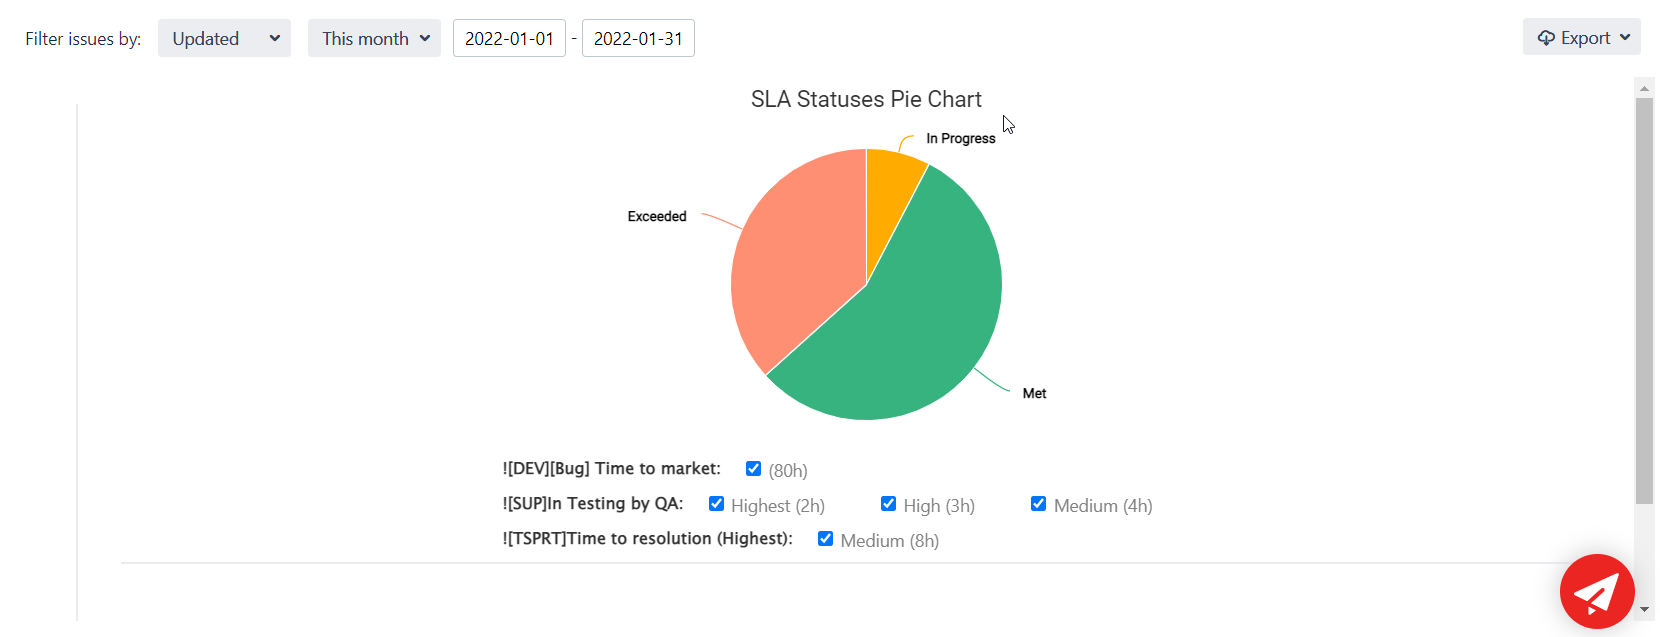
SLA Statuses Pie Chart
SLA Statuses Pie Chart - shows an amount ratio of issues with different statuses of achieving SLA goals: in progress, met, and exceeded. Under the Pie chart, you can see the detailed information about SLA goals and turn on/off some of them from a graph.
SLA Met vs Exceeded per Assignee
This type of report allows comparing results of work for up to three assignees in dynamic.
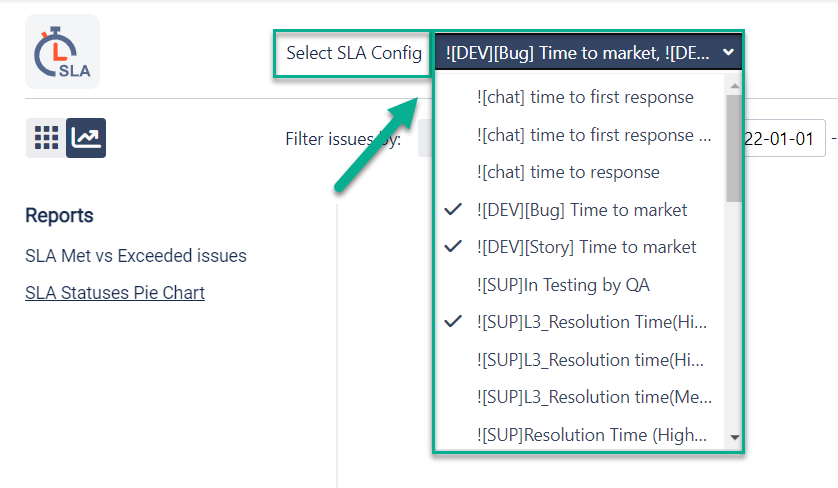
For each type of chart view, you can select SLA configs you want to view statistic data about.
Also, you can filter the issue lists by date ranges they have been created, updated, or resolved.
All graphs are available for export in PNG, JPEG, PDF, or SVG format.
This add-on allows you to copy JSON URL for any SLA chart and use it as a source for external clip builders (e.g., Klipfolio, Gekoboard) to share it within your organization. Read more about the Capture and Copy feature.
.jpg?version=1&modificationDate=1613646262267&cacheVersion=1&api=v2&width=442&height=466)
Haven't used this add-on yet, then try it now!