...
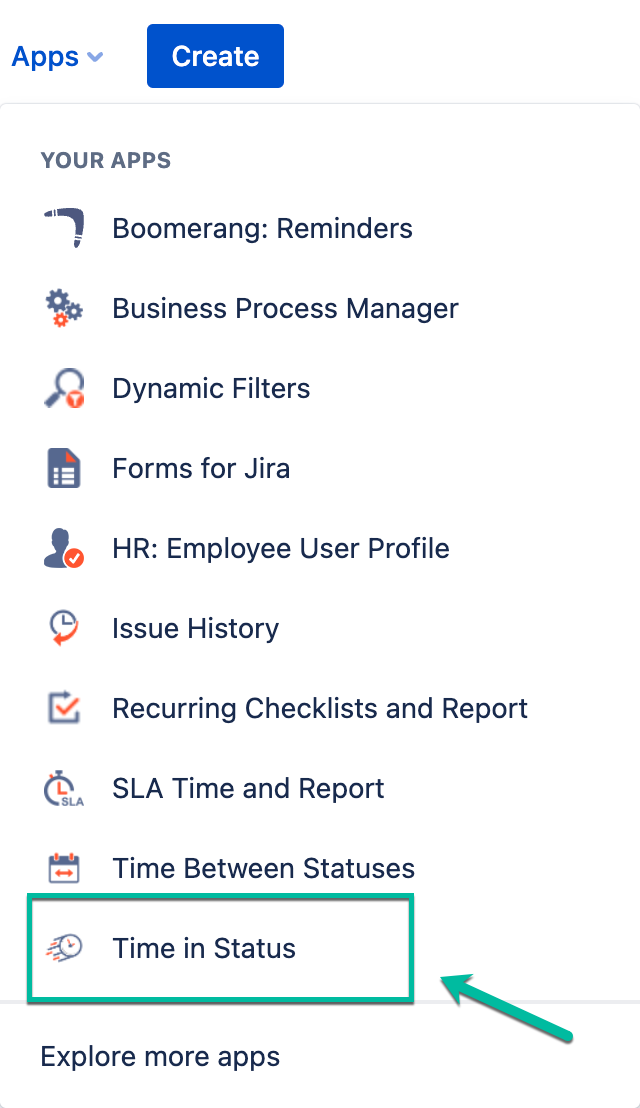
Find the installed Time in Status for Jira Cloud add-on below the Jira settings menu and click it to open.
1. Report generation
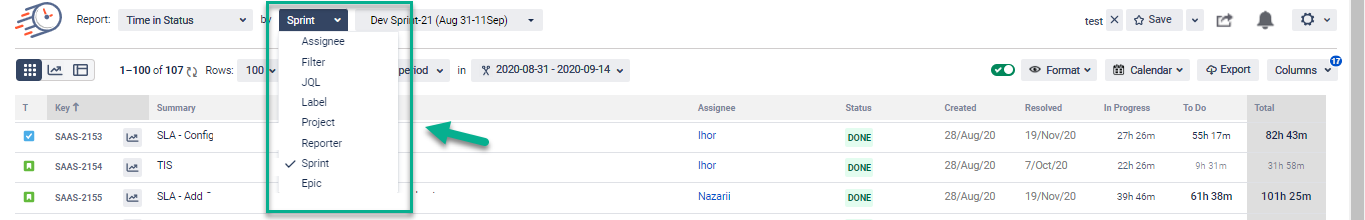
Choose a report type you want to generate (see the list of reports below).

When generating the reports, you can filter data by:
- Assignee,
- Filter,
- Label,
- Project,
- Reporter,
- Sprint,
- JQL,
- Epic.
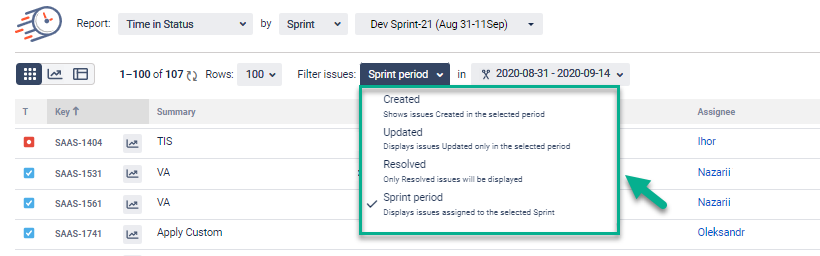
Date ranges
Use the Date ranges functionality to choose the calculation period.
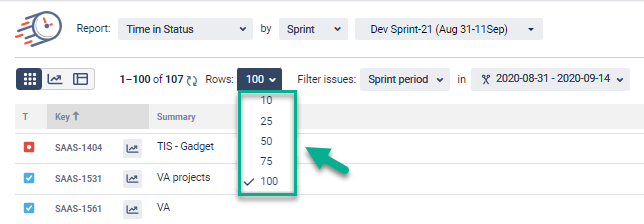
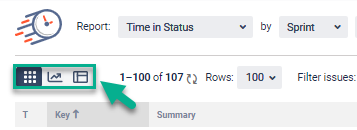
Choose how many rows will be displayed on the grid in the drop-down list.
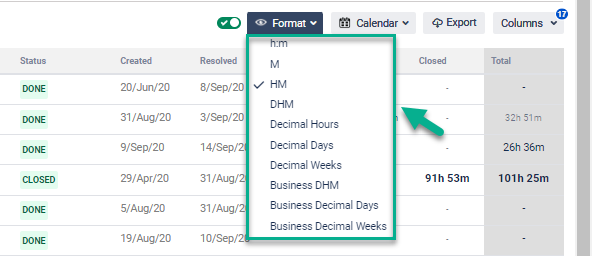
Time format
...
- DHM (Days, Hours, Minutes),
- HM (Hours, Minutes),
- h:m (hours: minutes),
- M (Minutes),
- Decimal Hours,
- Decimal Days,
- Decimal Weeks,
- Business DHM,
- Business Decimal Days,
- Business Decimal Weeks.
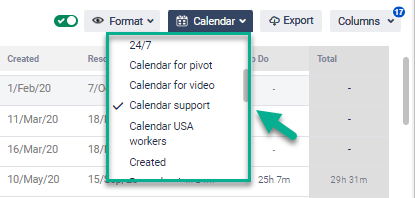
Choose Calendar
You can choose a custom calendar you've added previously or a default 24/7 to generate data.
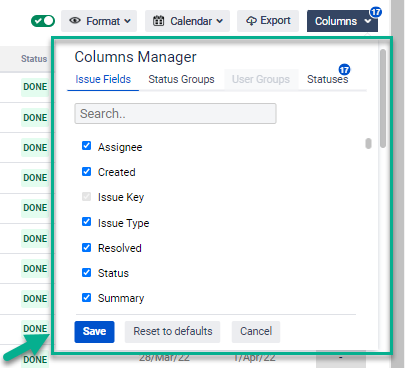
2. Column Manager
...
- Issue Fields (fields that are displayed on the grid),
- Status Groups (organize statuses in a single group),
- User Groups (organize users in a single group),
- Statuses (choose statuses that will be displayed on the grid).
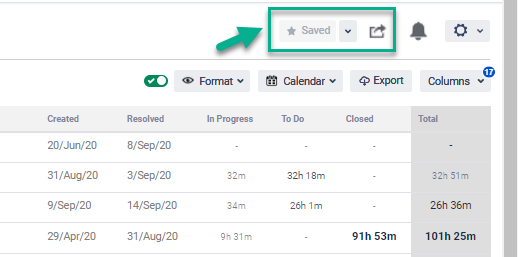
3. Save&Load and JSON Data Feed link options
These functions allow saving presets (configurations) and sharing them with the third-party systems.
4. Data presentation
...
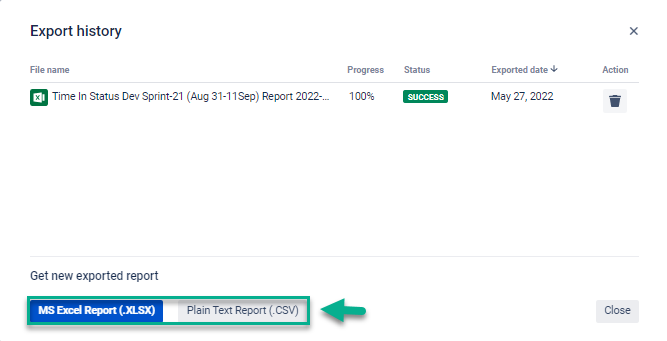
5. Export
Export data as XLSX or CSV files.

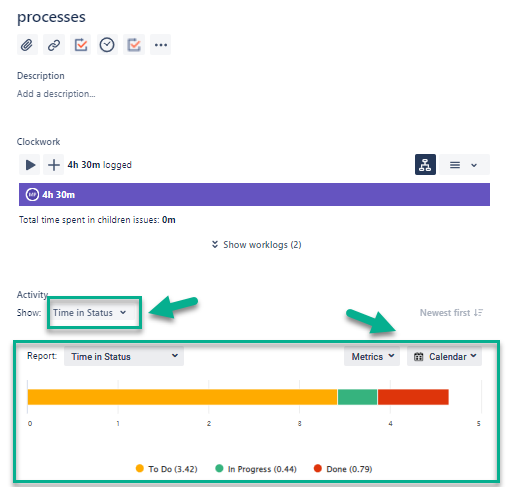
6. Issue View Panel
...
Here you can select one of the Report types, configure Metrics and Calendar options.
Check out more add-on features >>>
...