The Average time report shows the average time issues have been staying in statuses during a specific period.
Choose the Average time report;
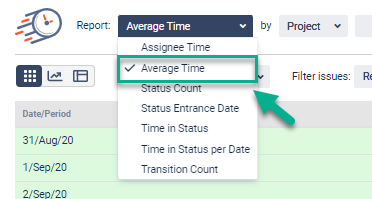
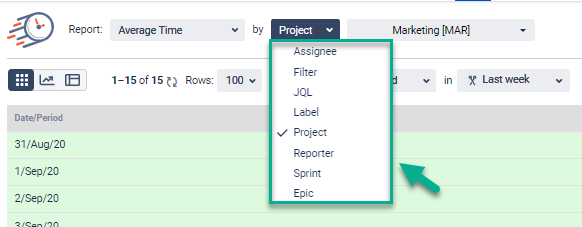
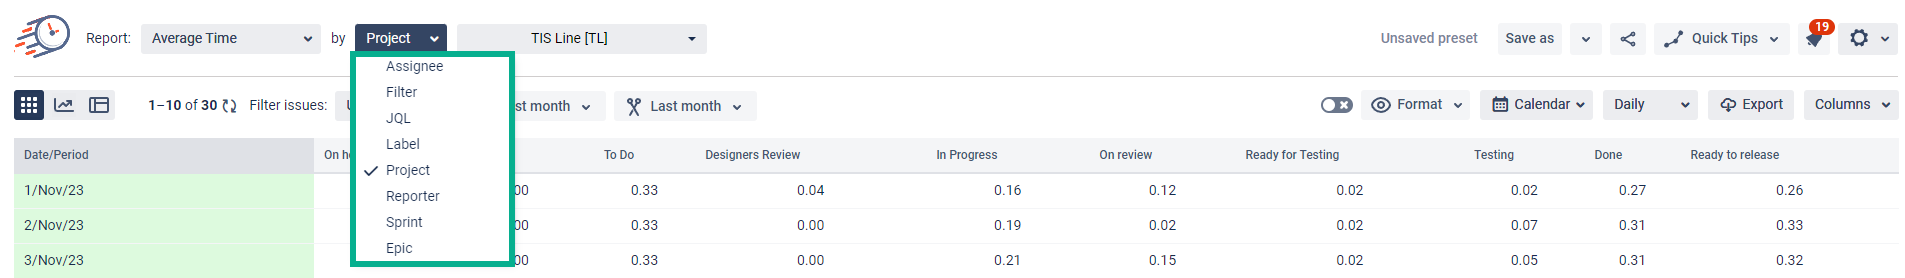
2. Filter by the category you need;
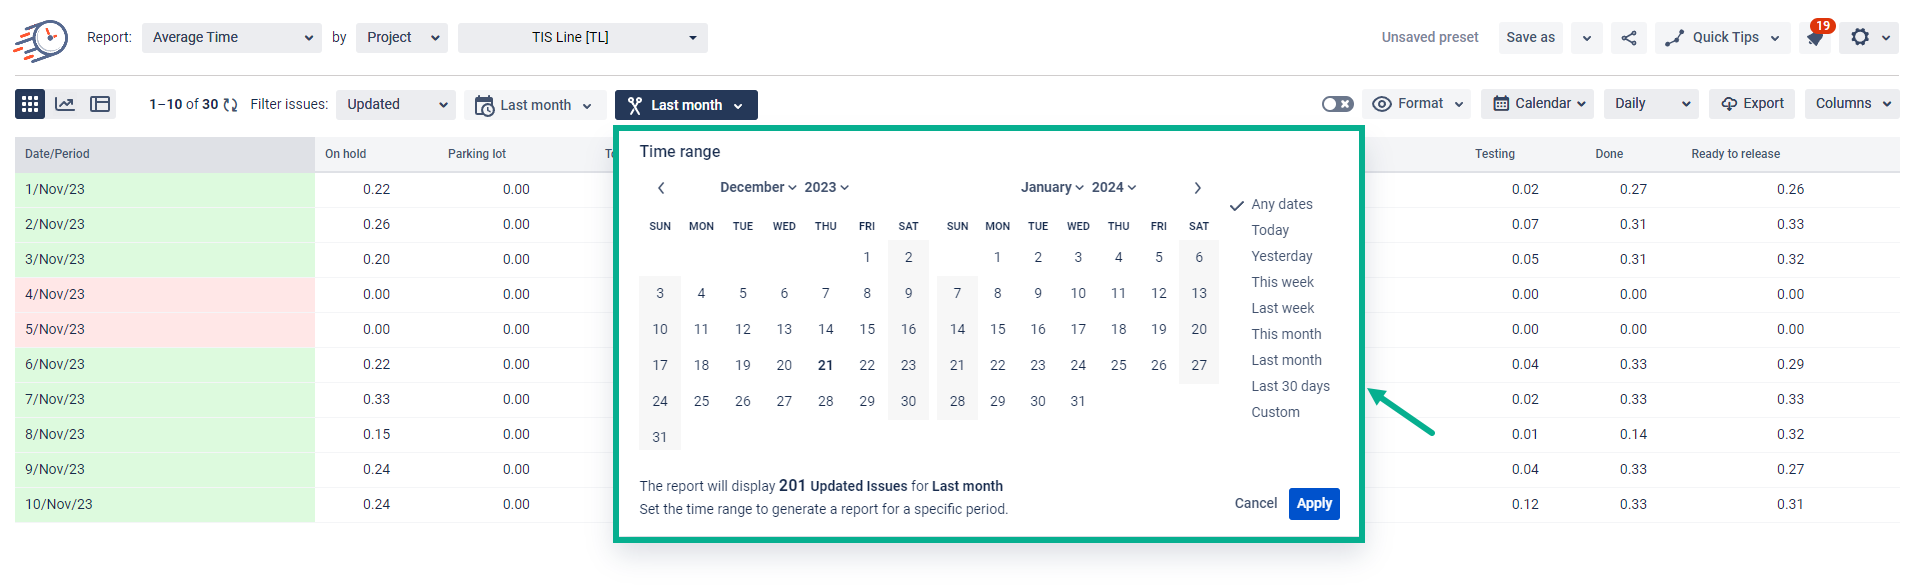
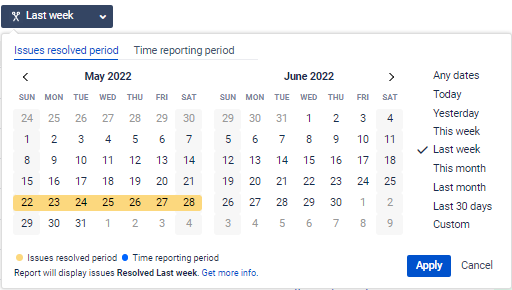
3. Choose the date ranges for the data calculation;
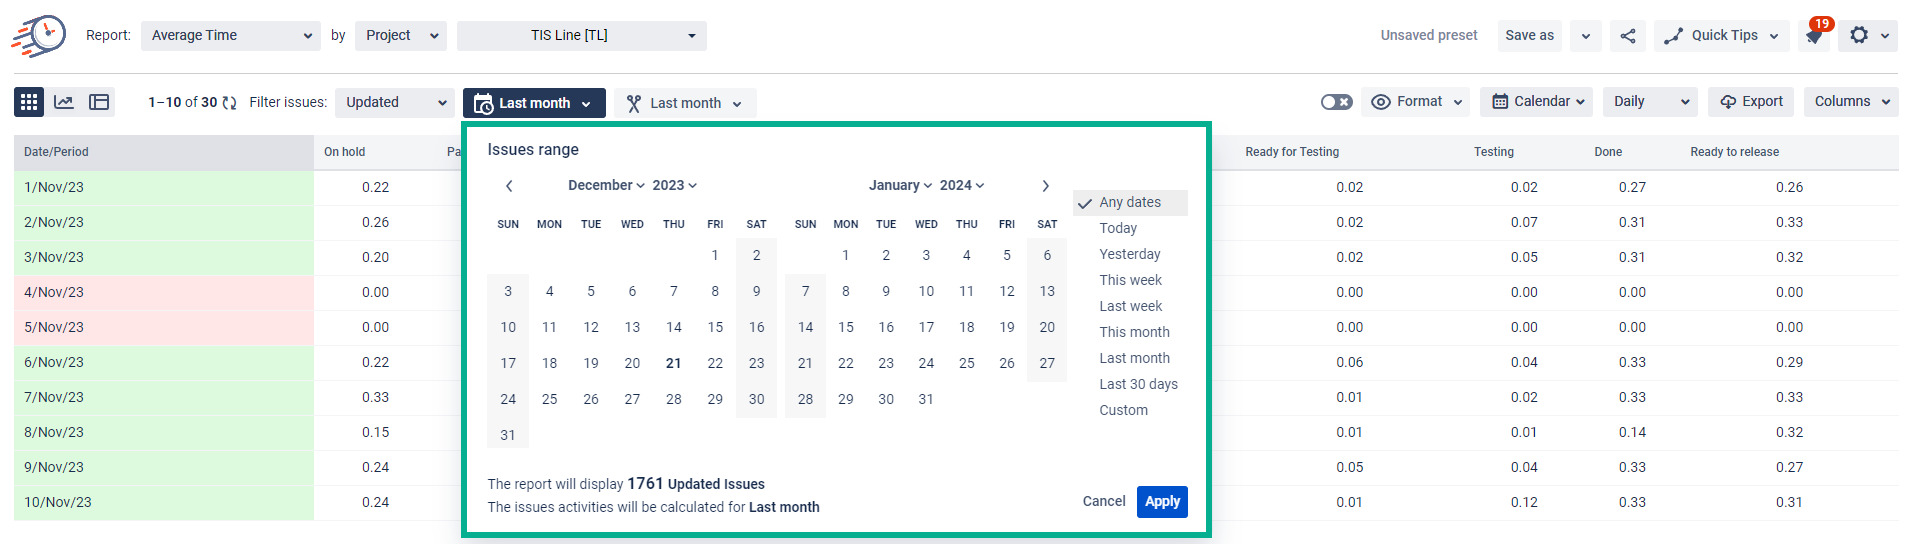
Choose the issue range for the data calculation;
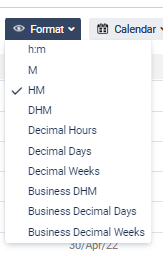
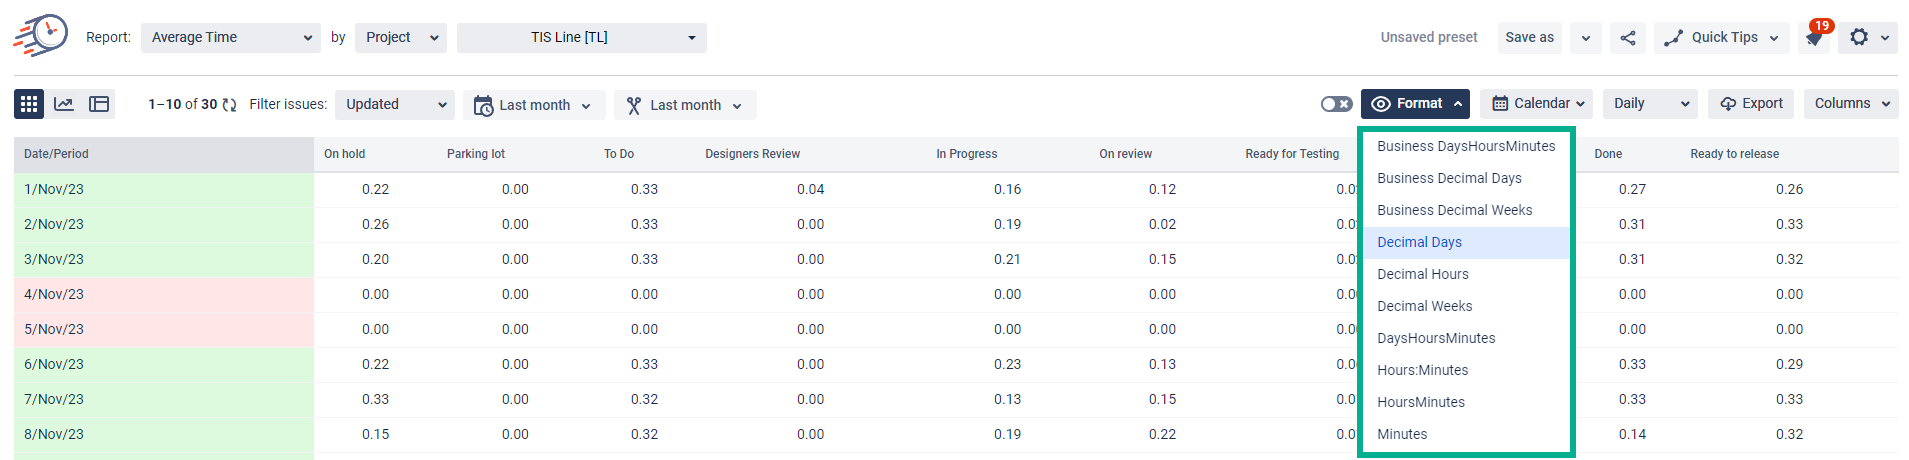
46. Select a time format type that will be represented on the grid;
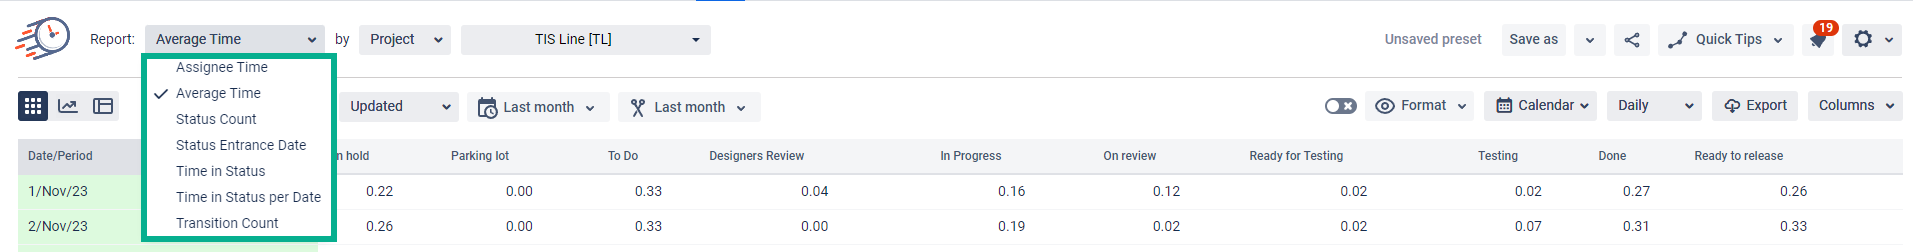
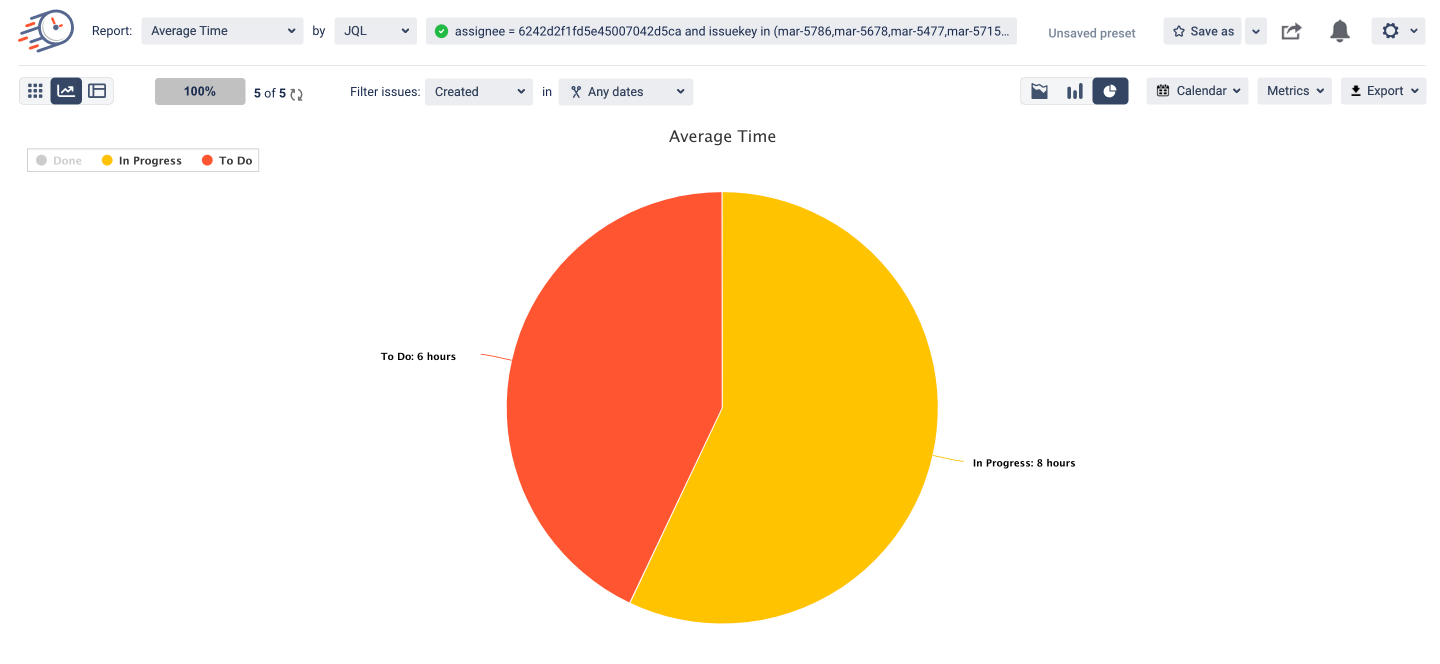
On the Bar and Area Charts, the average time of the tasks, that have been staying in status for a given period is displayed. For example, 3 tasks out of 4 on the 24th of May were in the To-Do status for 5, 7, and 6 hours. So the average time in To-Do status for the 24th of May - (5 + 7 + 6) / 3 = 6.
Here’s an explanation of how the Average time calculation procedure occurs and how to get the Average time report for each assignee.
| Panel | ||||||||
|---|---|---|---|---|---|---|---|---|
| ||||||||
| Info |
|---|
If you need help or want to ask questions, please contact SaaSJet Support or email us at support@saasjet.atlassian.net |
| Tip |
|---|
Haven’t worked with the add-on yet? Give it a try⬇ |