The Time in Status per Date report sums up the time the task has been staying in each status at a particular date.
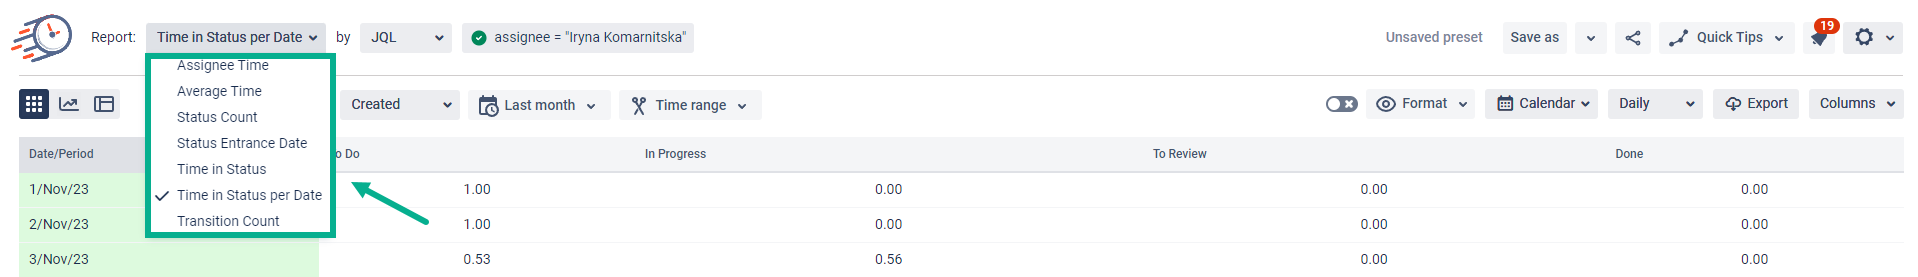
Choose the Time in Status per Date report;
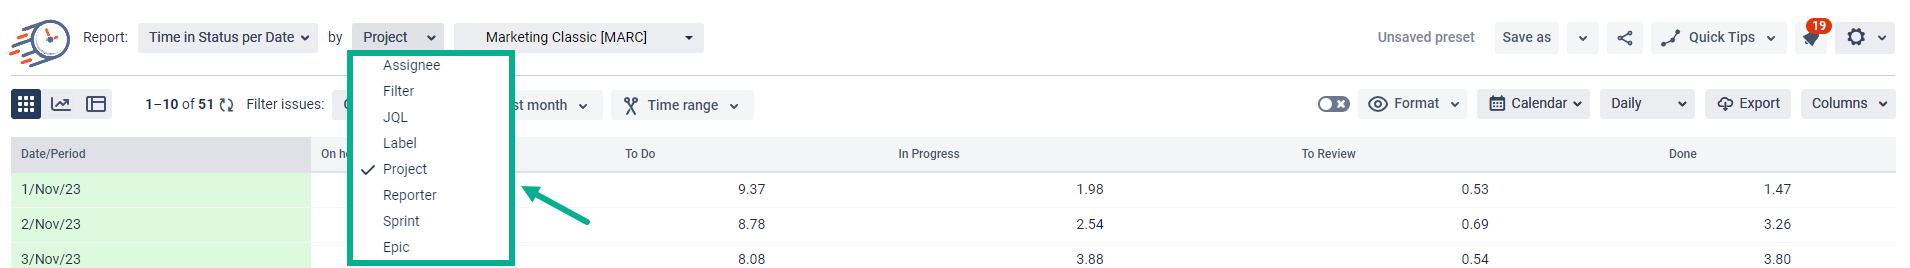
2. Filter by the category you need;
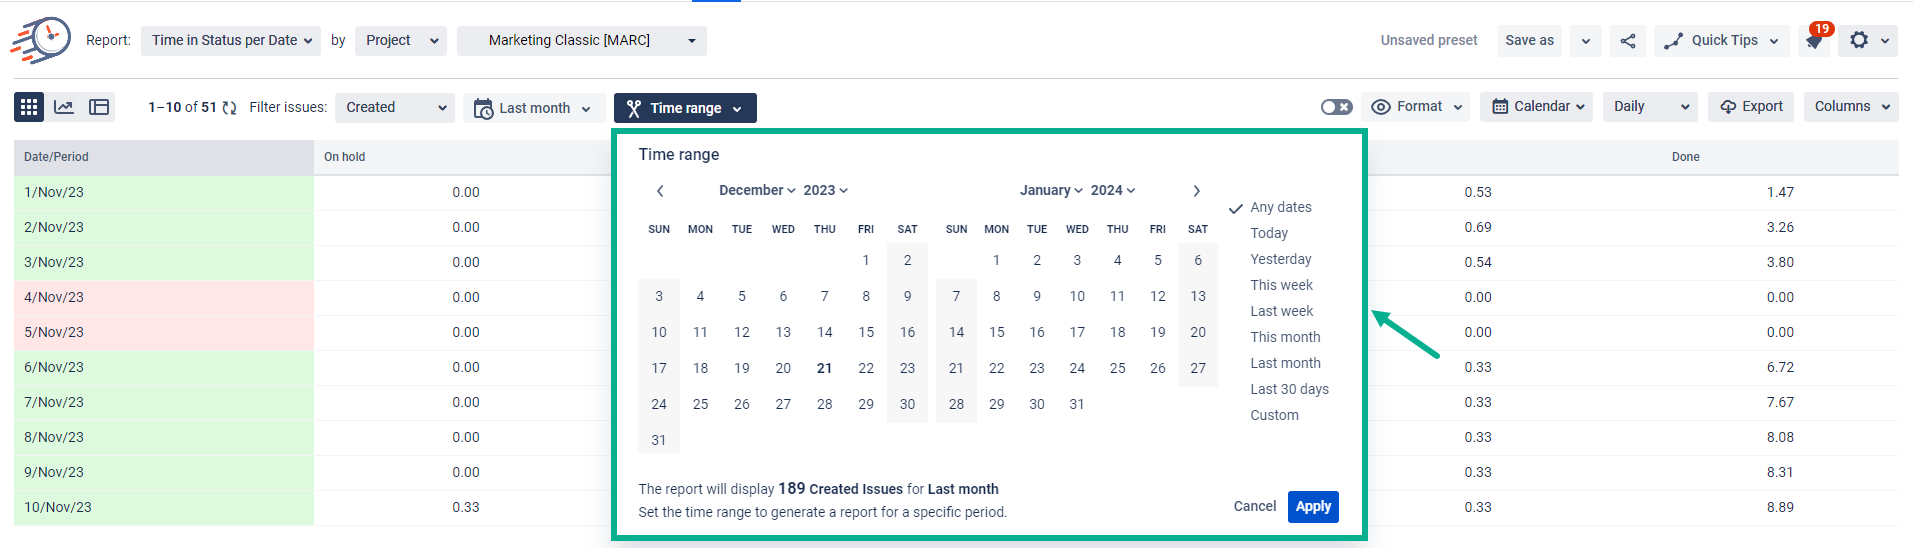
3. Choose the date rangesfor the data calculation;
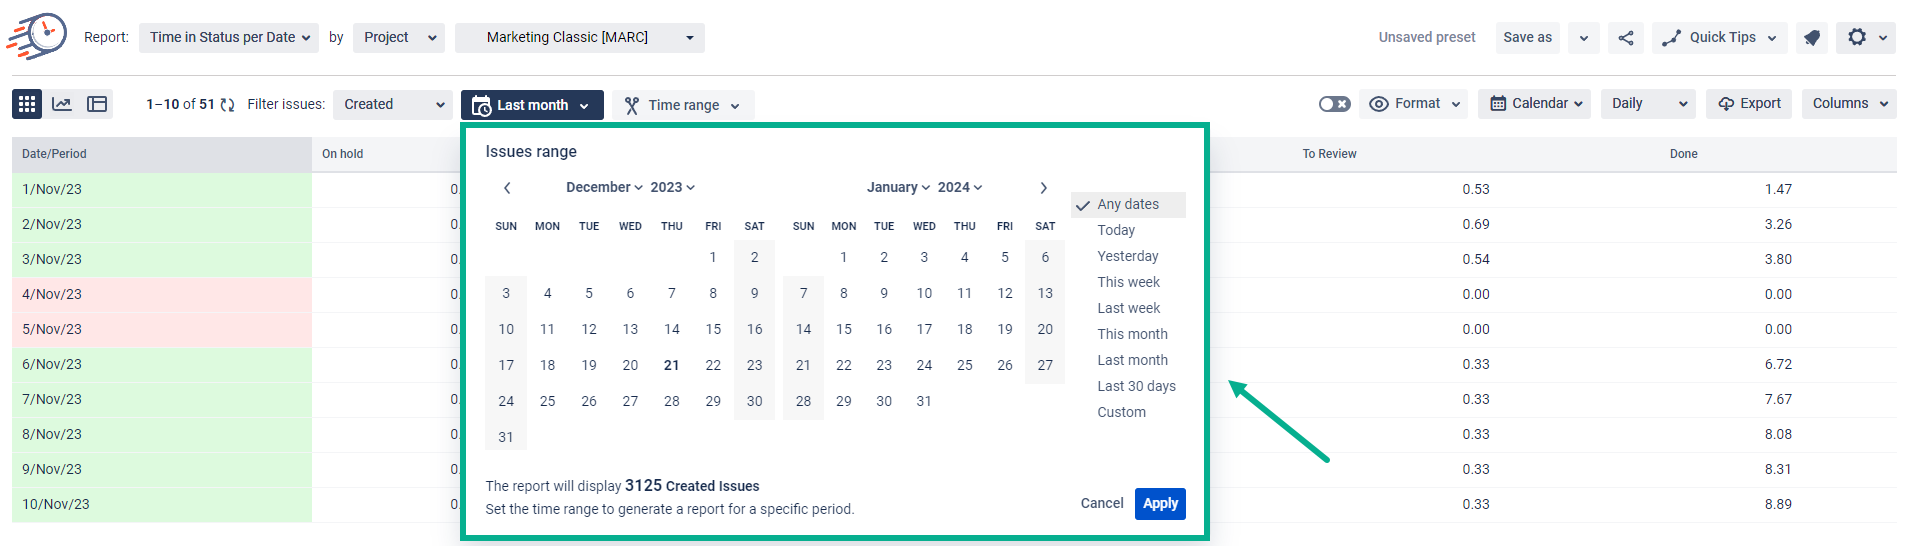
4. Choose the issue range for the data calculation;
5. Choose a time format type that will be represented on the grid;
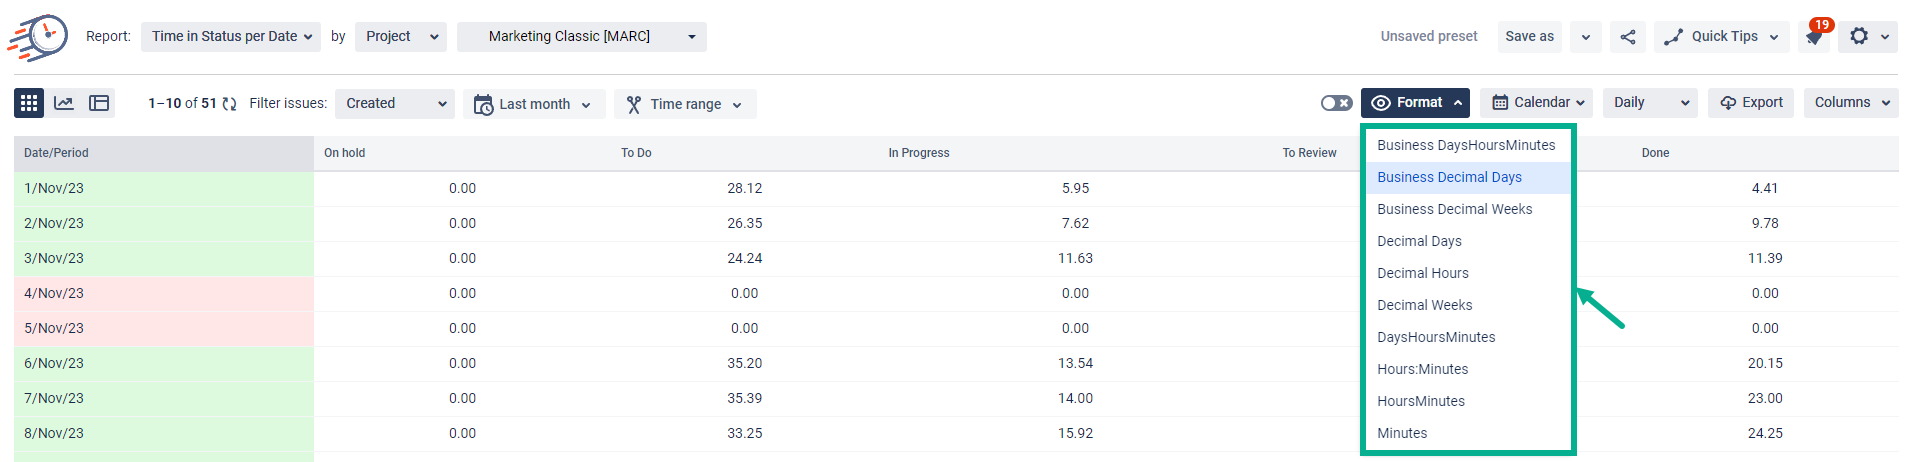
6. Get all the data on the grid as shown below.
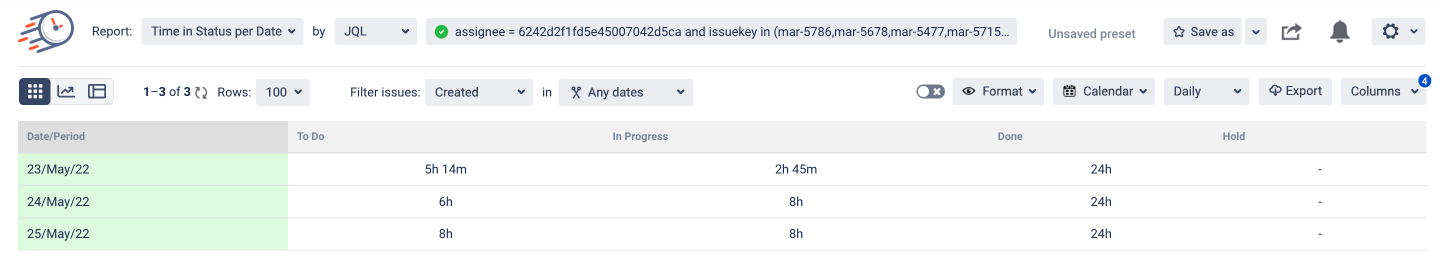
Time in status per Date counts the total time the sample tasks have spent in statuses.
For example - on the 24th of May, 3 tasks out of 6 were in To-Do status for 2, 3, and 1 hours. So for the To-Do status on the 24th of May, the time in the status is 2 + 3 + 1 = 6 hours
(for the graph and the grid the calculation process is the same)
| Panel | ||||||||
|---|---|---|---|---|---|---|---|---|
| ||||||||
| Info |
|---|
If you need help or want to ask questions, please contact SaaSJet Support or email us at support@saasjet.atlassian.net |
| Tip |
|---|
Haven’t worked with the add-on yet? Give it a try |