Issue History for Jira is your retrospective journal for every past activity. As a result, you’ll get a report with all changes for the required list of issues.
Watch the video tutorial to get started or follow the steps bellow ⬇
| Widget Connector | ||||||||||
|---|---|---|---|---|---|---|---|---|---|---|
|
Find the installed Issue History add-on below the Jira settings menu and click
...
it to open
...
.
...
1. Select issues
For generating the reports, you can filter the data by: by Assignee, Filter, Label, Project, Reporter or Sprint Filter, Label, Project, Reporter, Sprint, etc.
Also, you can filter issues by a person, who has made updates. 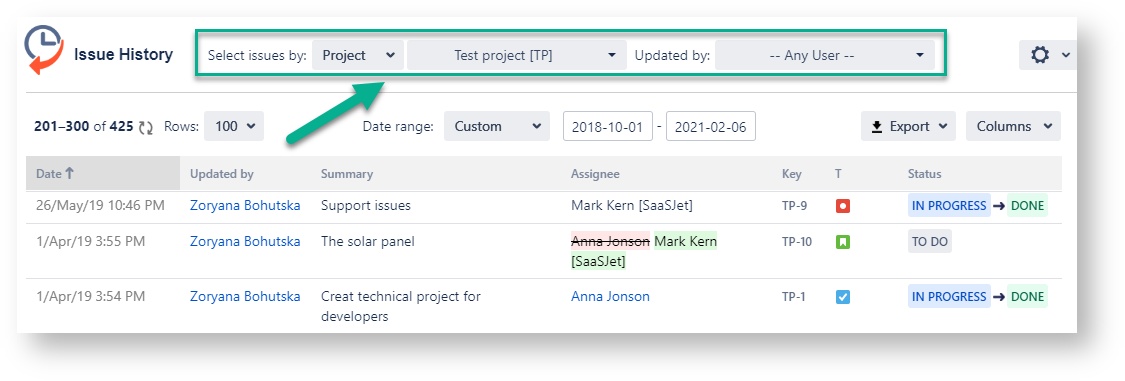
...
2. Date Ranges
Use the functionality of Date ranges to customize report timeframes.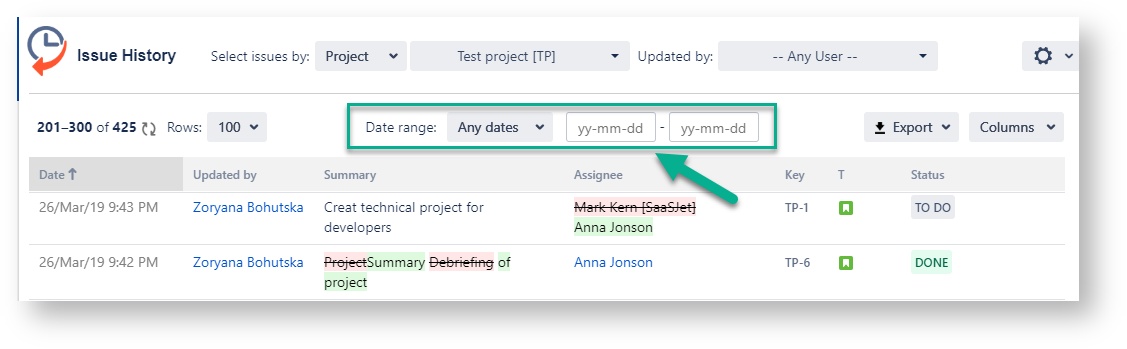
...
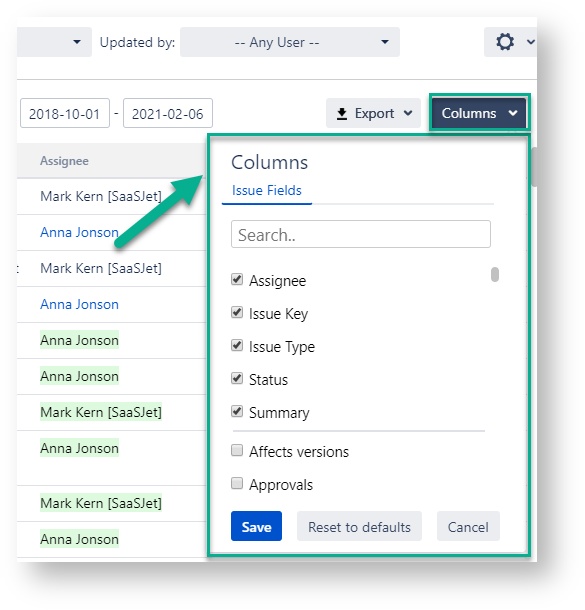
3. Column Manager
You can add custom and standard fields to the grid using using the ‘Columns’ menu to play with output data.
...
Active fields (1) show which issue fields are included in the report and all changes for them.
Updated fields (2) are all other issue fields you can include in the table and get changes for them.
The number in the right corner shows how many changes were made to each field.
Drag-n-drop any of the columns to change their order:
...
*Also, you can sort by any column by clicking on its header.
4. Transition filter
Click on the status filter to select specific transitions you want to monitor changes about:
For instance, Backlog-To Do, To Do-In Progress, In Progress-Done
...
5. Issue Filter
Click on the issue filter to select specific ones you want to monitor changes about:
...
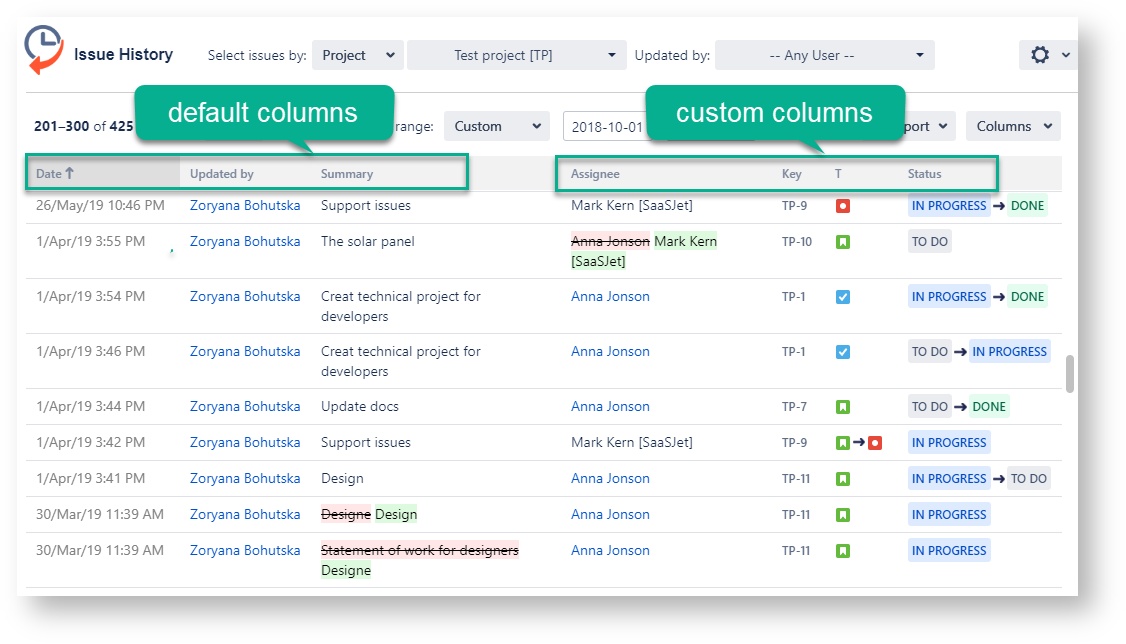
Issue history report
After the previous settings, you will receive a report with the changes that have been made in the issues you need to see.
The main report grid displays the data according to the the default and custom columns you you have selected before in the column manager.
4. Additional information
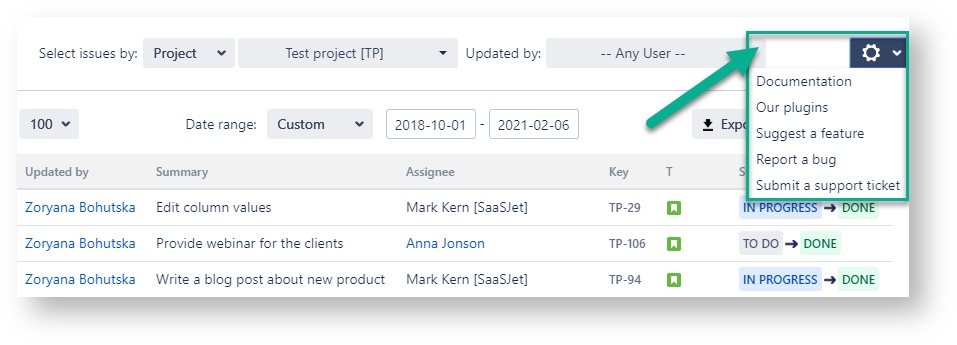
At the drop-down box ‘Setting’ (available on the top right corner as a black gear) user can select ‘Documentation’, ‘Our plugin’, ‘Request a Feature’, ‘Report a Bug’ and‘Submit a support ticket’
...
6. Data Export
You can export the Data data from the grid as XLSX XLSX or CSV file which files which you can analyze using such tools like as Excel or Google Spreadsheets.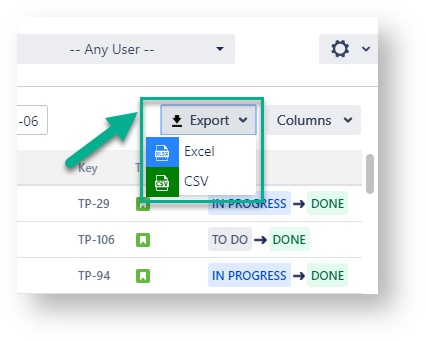
...
7. Sorting by column’s header
You can choose different options for sorting.
Sort by each column’s header
Sort only by date and remove sorting by another field by pressing the arrow.
...
| Info |
|---|
Sorting of issues is proceeding by the actual issue field’s value only. |
When you click on the column’s header, the sorting logic is the following: in the first raw you’ll get the actual value of the issue field you’re sorting by. For example, you’re sorting by status. So the first raw of every issue will show the current status, then all the following status changes.
...
8. Additional information
Find more helpful options available in the top right corner as the three dots: ‘Documentation’, ‘Get support’, ‘Suggest a Feature’, ‘Report a Bug’, ‘Book a demo’, ‘Product tour‘, and ‘Our add-ons’. There is a separate ‘Permission‘ option to manage accesses.
...
Haven't used this add-on yet, then try it now! >>>you’re welcome to try It ⬇
...