The Average time report shows the average time issues have been staying in statuses during a specific period.
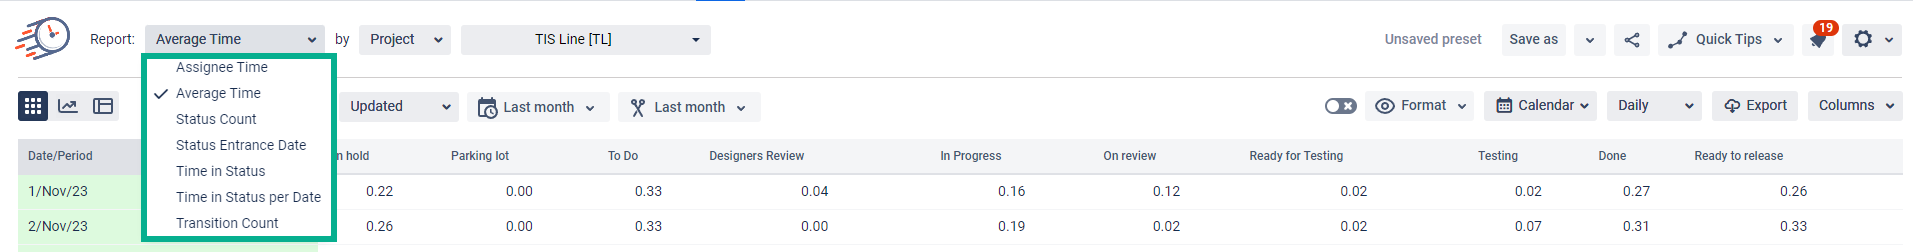
Choose the Average time report;
...
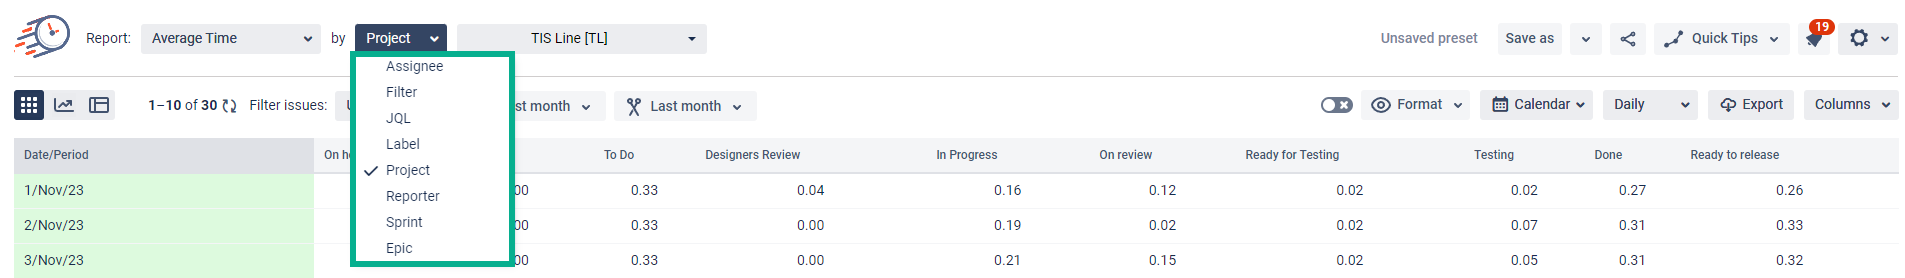
2. Filter by the category you need;
...
...
...
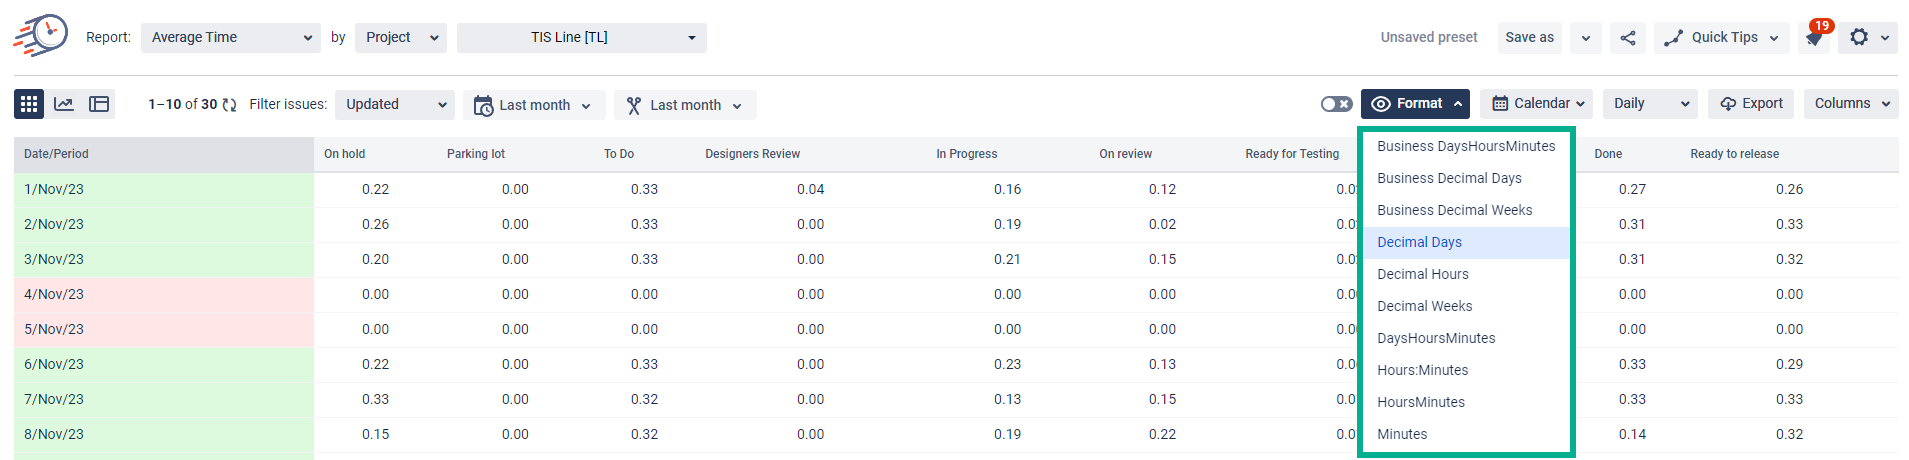
6. Select atime format type that will be represented on the grid;
...
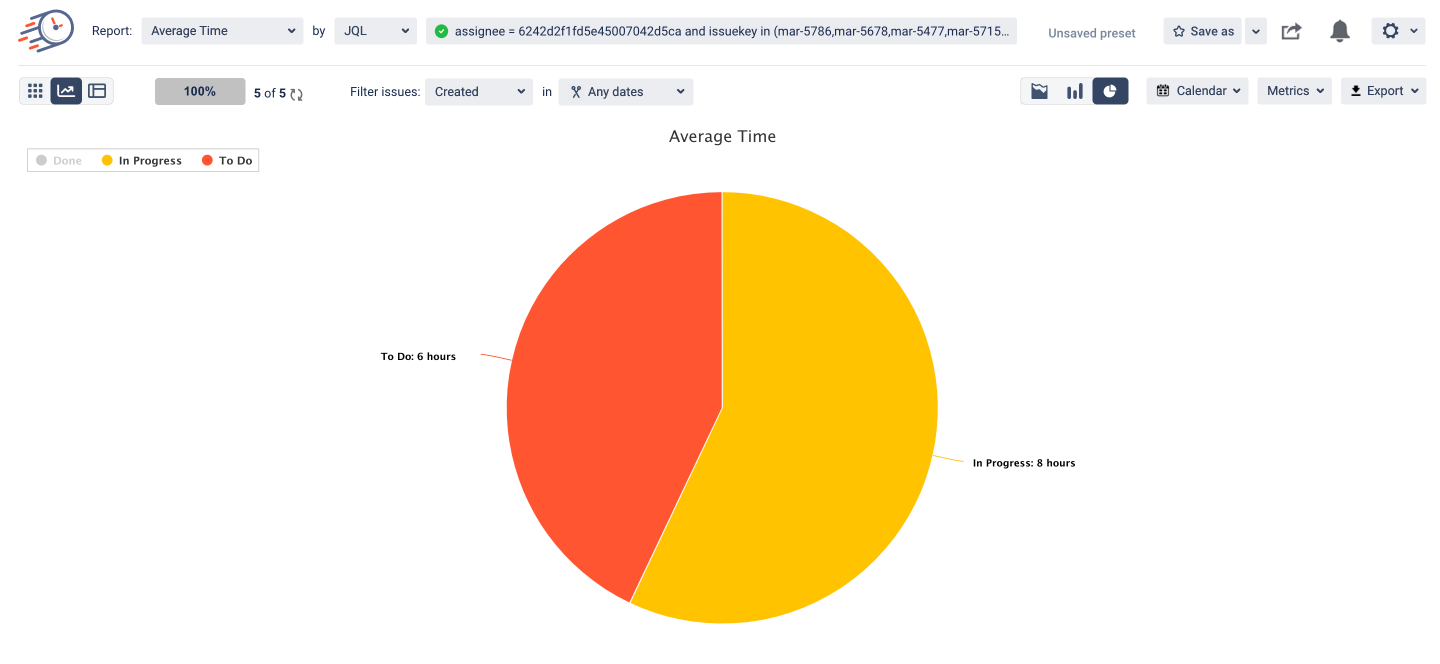
On the Bar and Area Charts, the average time of the tasks, that have been staying in status for a given period is displayed. For example, 3 tasks out of 4 on the 24th of May were in the To-Do status for 5, 7, and 6 hours. So the average time in To-Do status for the 24th of May - (5 + 7 + 6) / 3 = 6.
...
How does the calculation of the Average time occur?
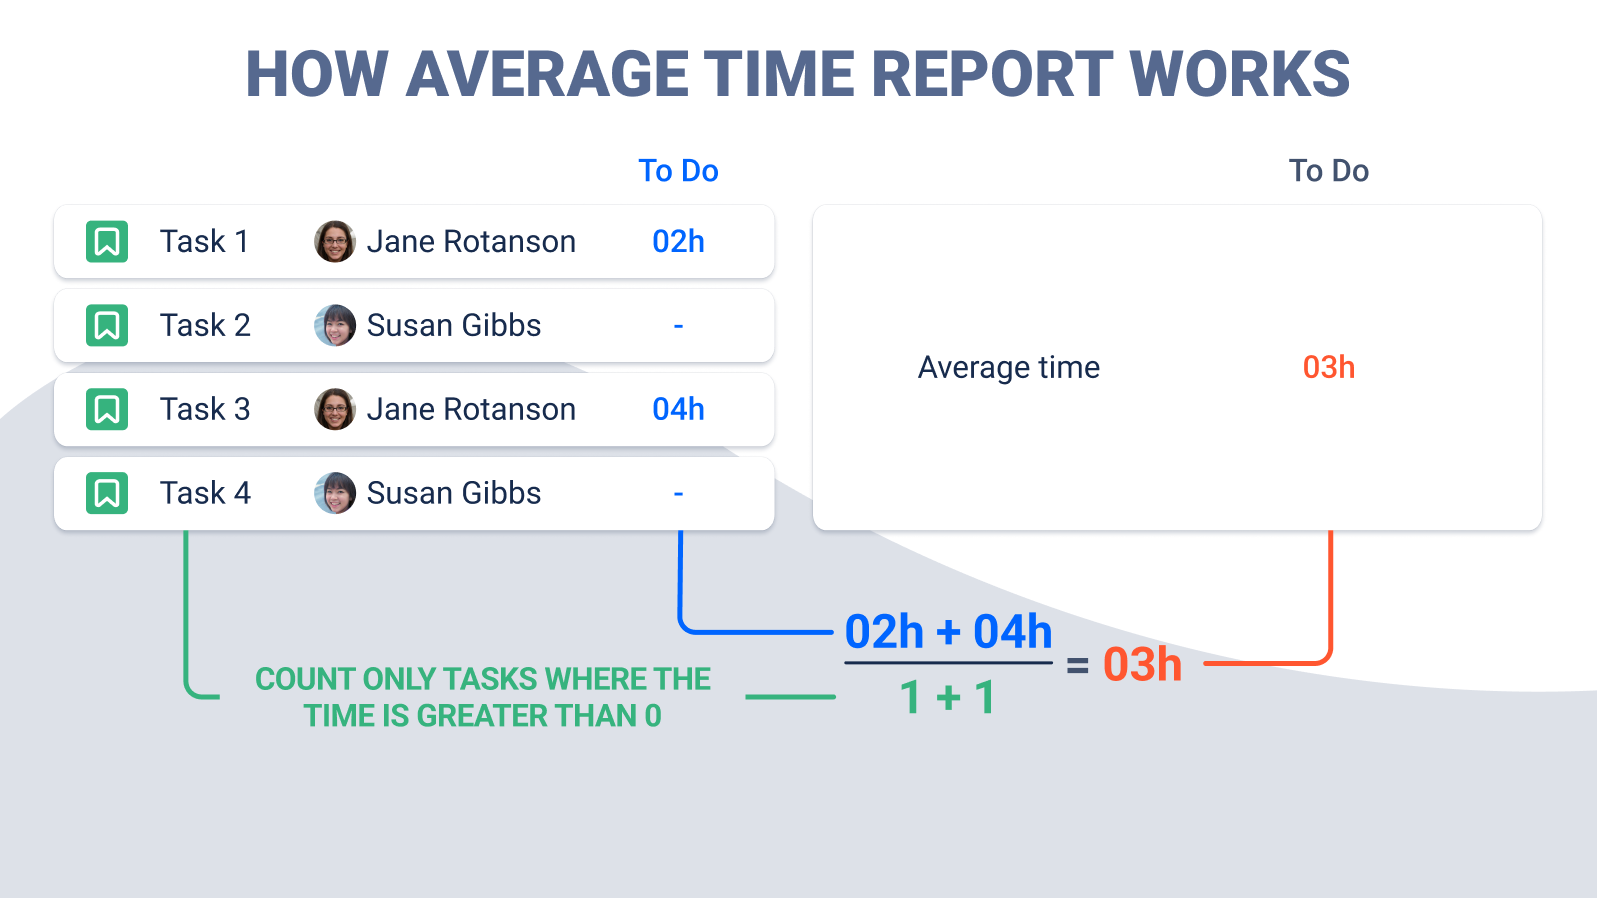
The picture shows the logic of calculating the Average time.
We count the number of tasks that have been in a particular status (To-Do status in this case) (green line),
Then, sum up the time spent on these tasks (blue line). We take into account only those tasks that have been in the status.
Divide the total time by the number of tasks. (1/2)
This is how the calculation of each value on the grid is occurring.
Here’s an explanation of how to get the Average time report for each assignee.
| Panel | ||||||||
|---|---|---|---|---|---|---|---|---|
| ||||||||
| Info |
|---|
If you need help or want to ask questions, please |
...
contact SaaSJet Support or email us at support@saasjet.atlassian.net |
| Tip |
|---|
...
Haven’t worked with the add-on yet? |
...