What is Time in Status for Jira Cloud Gadget
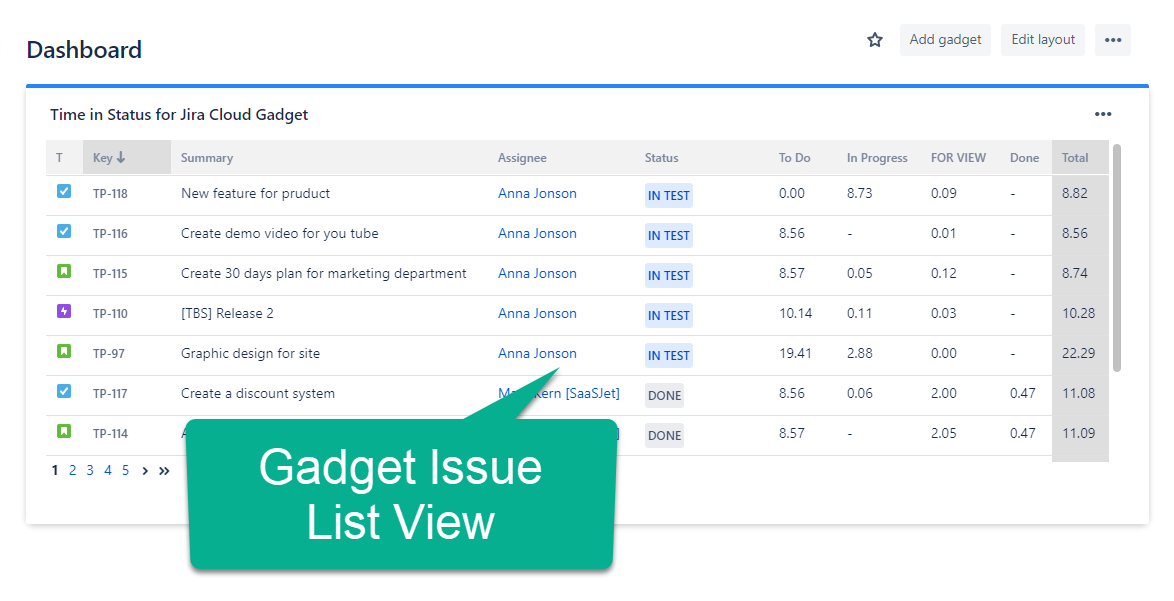
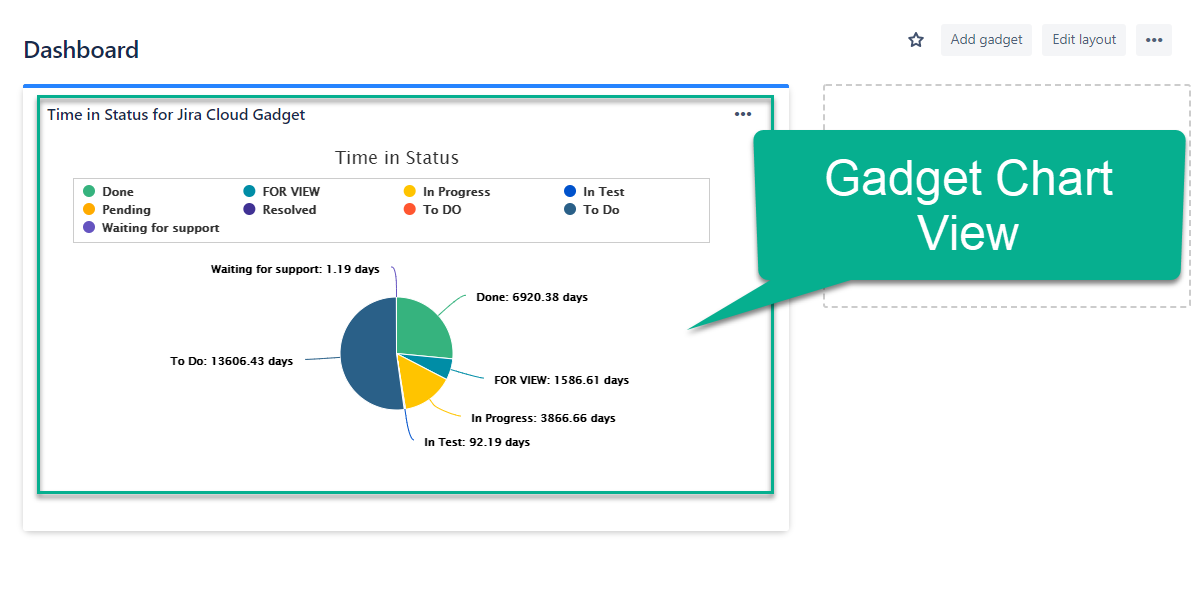
Time in Status for Jira Cloud Gadget – the tool that lets you monitor customized reports from the app on the Jira dashboard. All add-on reports are available at this gadget and you can control time in status data in Issue List or Chart View.
How to install gadget to dashboard
First, you need the latest version of Time in Status for Jira Cloud add-on.
To update add-on, follow the update instructions if you've installed a plugin before the release.
In Jira, go to Dashboards.
Create a new dashboard or select an existing one.
Click the Add gadget button on the dashboard.
Write "time in status cloud" in the search box.
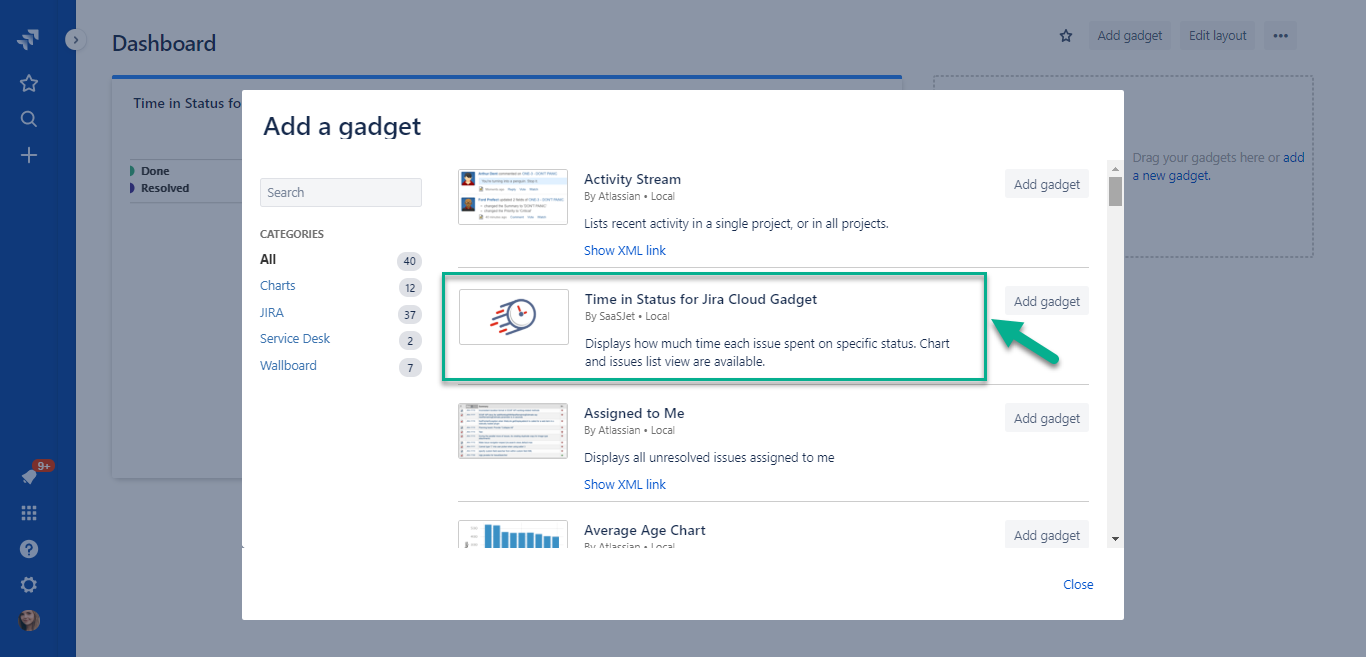
Select Time in Status for Jira Cloud Gadget (by SaaSJet) at the search results.
Click the Add gadget button.
You're all set!

Once you added the gadgets, close the Add a gadget screen and continue by entering the gadget settings. See below the instructions for how to configure the gadgets.
How to use
First of all, you need to configure the gadget by the following settings to view the data at the dashboard.
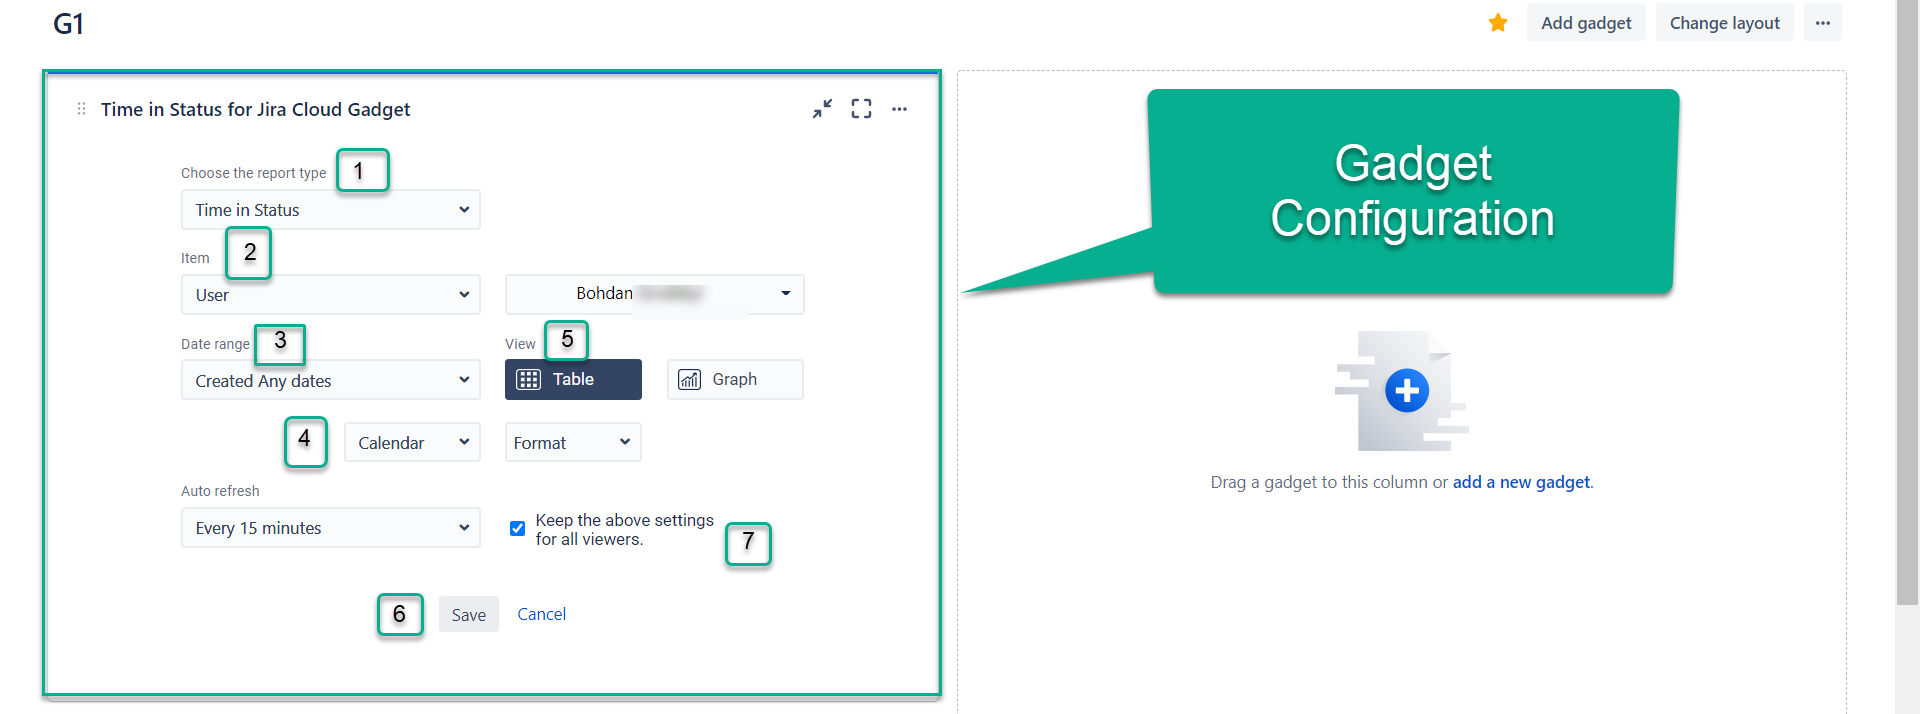
In Gadget Configuration you can set:
Type of reports (Time in Status, Assignee Time, Average Time, Status Entrance Date, Time in Status per Date, Status Count, and Transition Count). More information about reports here.
Choose how to get the issue list filtering data by Assignee, Filter, Label, Project, Reporter or Sprint and specify search details.
Use the functionality of Date ranges to customize report timeframes.
Select a Calendar to generate the data. There you can choose a custom calendar you've added previously or a default 24/7.
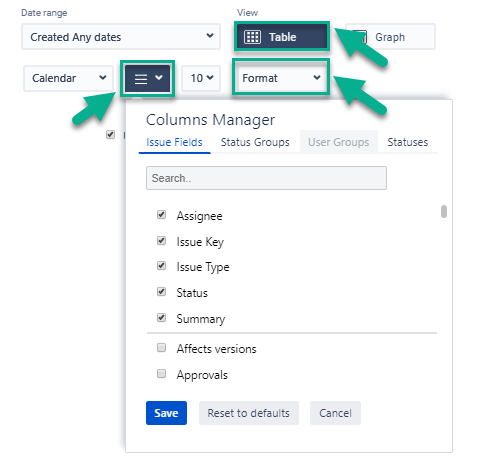
Choose the report view: Table (issue list) or Graph.
When you select the table view:
In the Column manager, you can select the Issue Fields, Status Groups (read more about Status Groups), User Groups (read more about User Groups) and Statuses.
Option Format lets you select the time format of status duration.
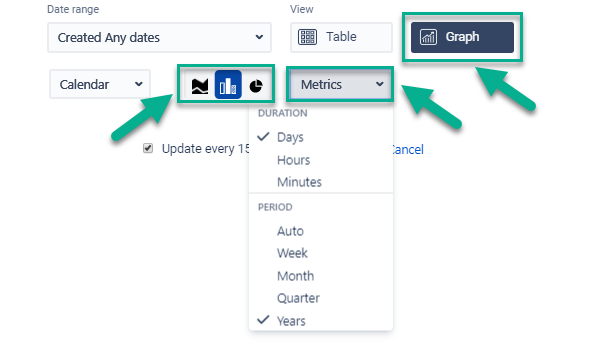
If you want to see the report as the graph:
There are three types of charts: Pie, Bar and Area.
To configure Metrics choose Duration and Period.
6. To confirm all configurations press button Save.
7. The checkbox allows sharing the Gadget on your Dashboard and displays it for all users. It must be active by default.
If a checkbox is off, users won’t see the gadget settings you have made.
If a checkbox is on, all users will see the settings you have made. Only users with the Admin role should be able to edit the Gadget.
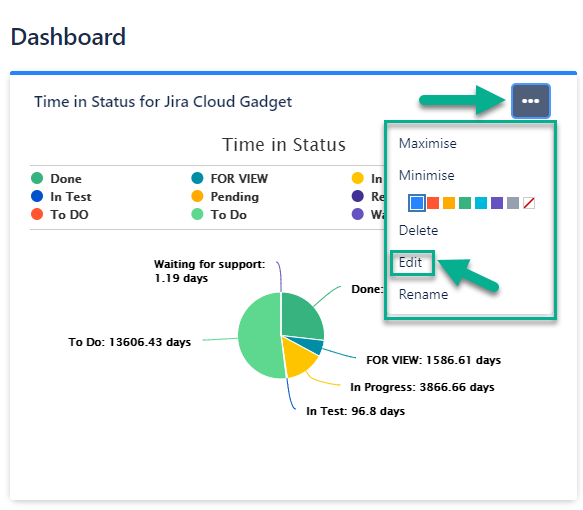
8. At any moment you can change the setting. Just choose the Edit button.
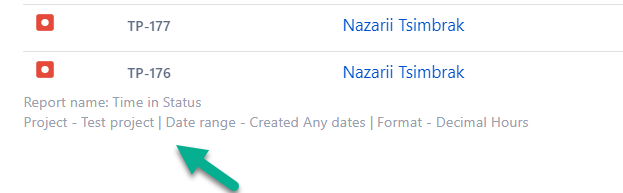
Also, you can view report settings on the widget.
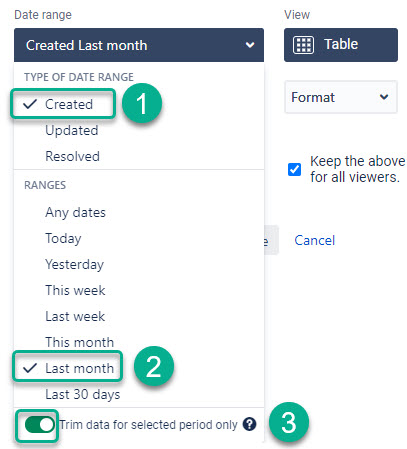
Calculation (trim) option for Gadget
3 steps to follow:
Filter the issues list by the type of date range.
Choose ranges for the data calculation. Custom selection is available only within the app.
Switch on the trim data button.
Learn more about this feature in the Issues and Calculation Periods section.
If you need help or want to ask questions, please contact SaaSJet Support or email us at support@saasjet.atlassian.net
Haven't used this add-on yet? Try it now >>>