You can get a helicopter view about SLA statuses to the issue you need using graphs at SLA Time and Reports.
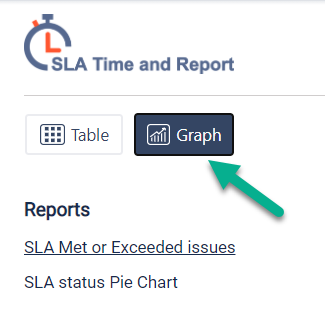
There are 2 kinds of charts:
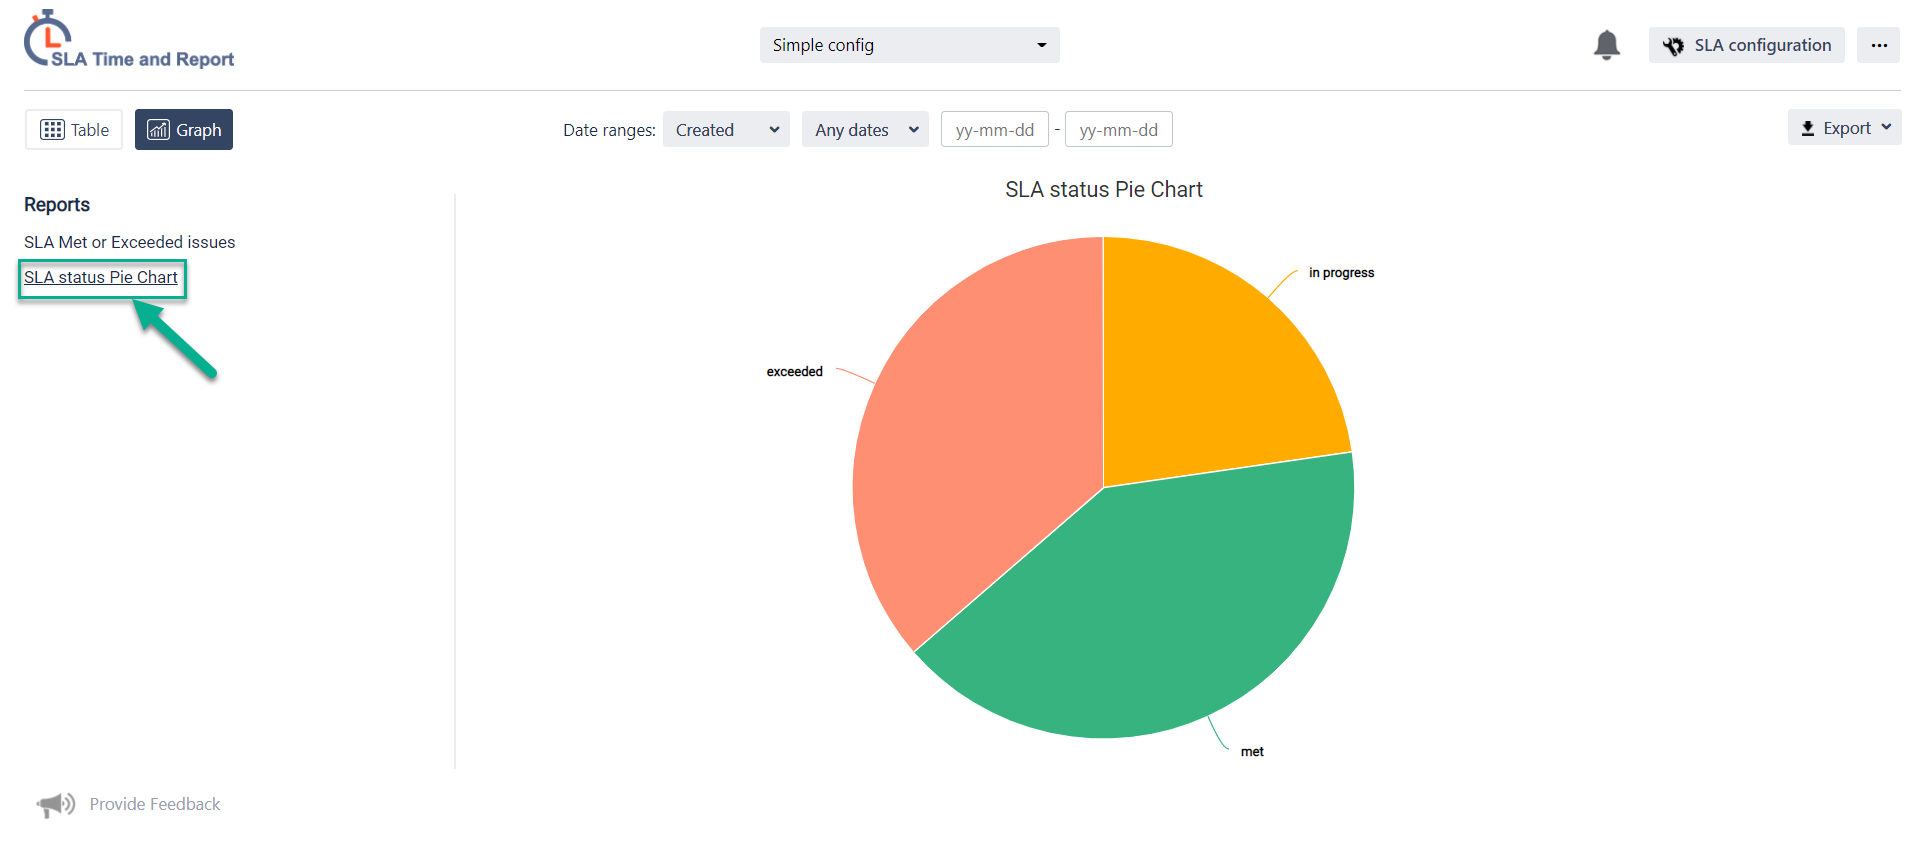
Pie Chart (SLA Met/In Progress/Exceeded)
Line Graphs (SLA Met & Exceeded)
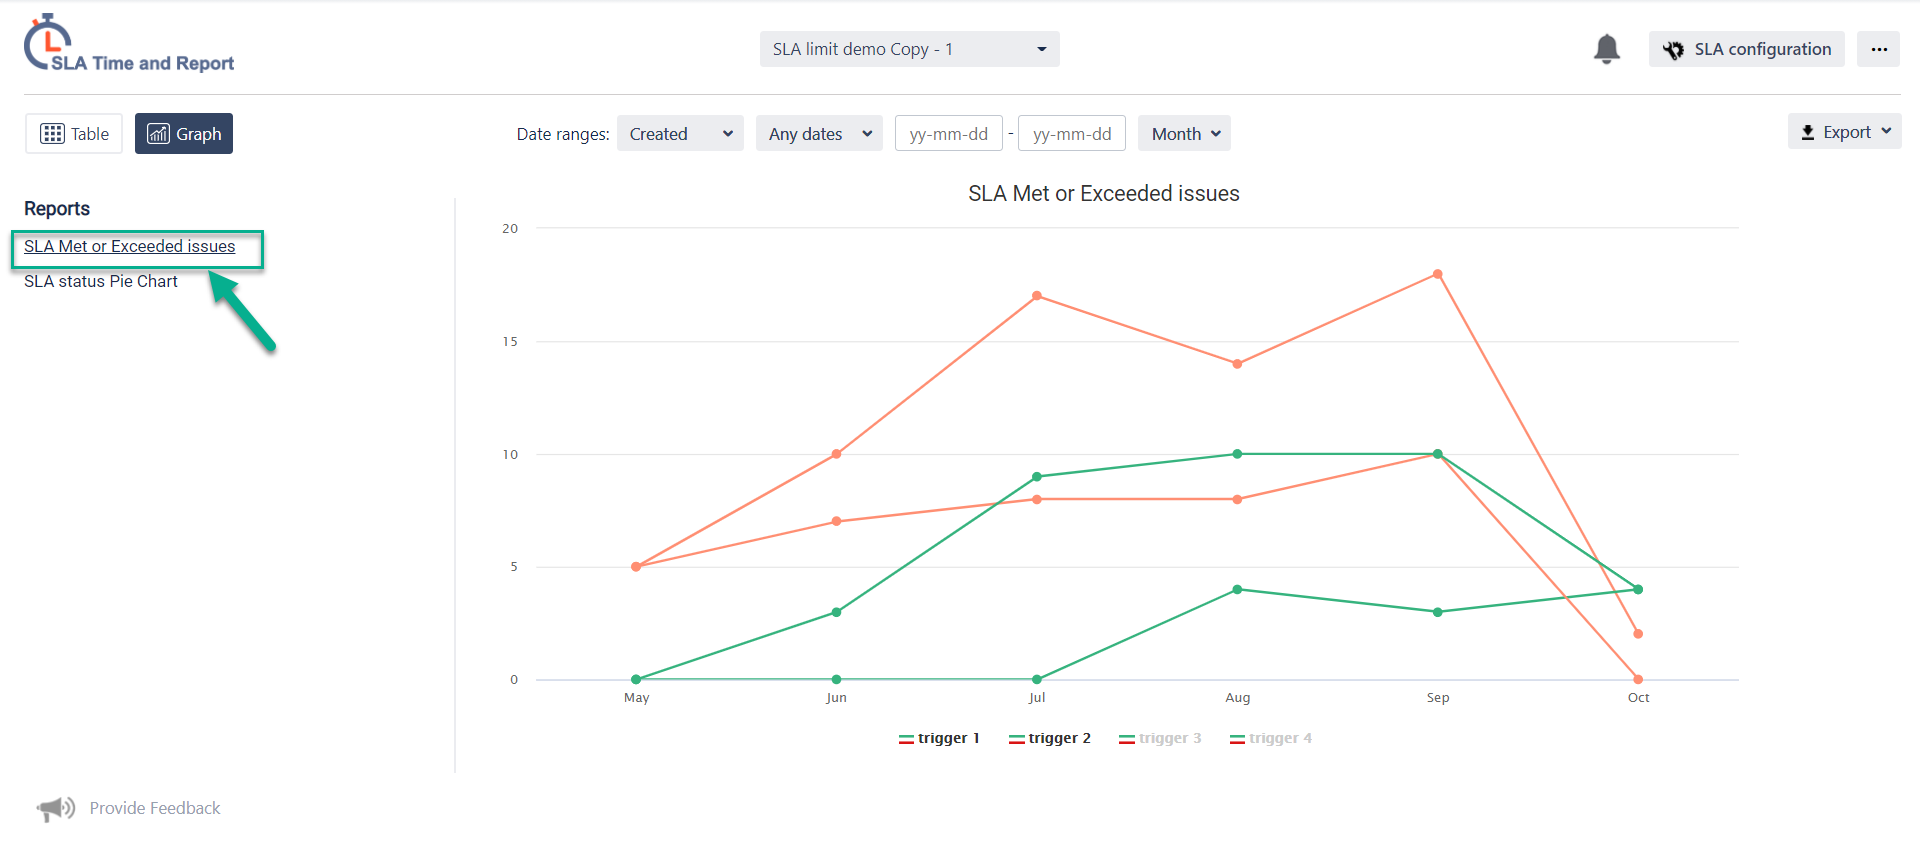
At the Line Graphs (SLA Met & Exceeded) all SLA config’s goals are available.
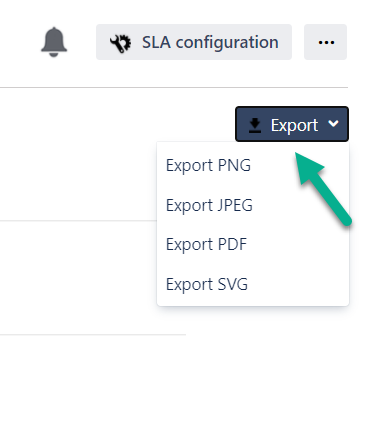
All graphs are available for export in PNG, JPEG, PDF, or SVG format.
Copy JSON URL for any SLA chart and use it as a source for external clip builders (e.g., Klipfolio, Gekoboard) to share it within your organization. Read more about the Capture and Copy feature here.
.jpg?version=1&modificationDate=1613646262267&cacheVersion=1&api=v2&width=340&height=358)
Haven't used this add-on yet, then try it now! >>>