You can get a helicopter view about SLA statuses to the issue you need using graphs at SLA Time and Reports.
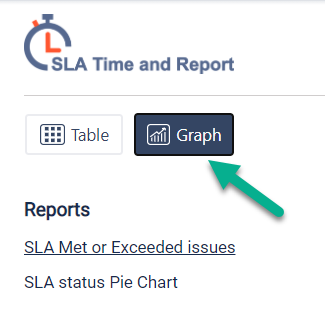
There are 2 kinds of charts:
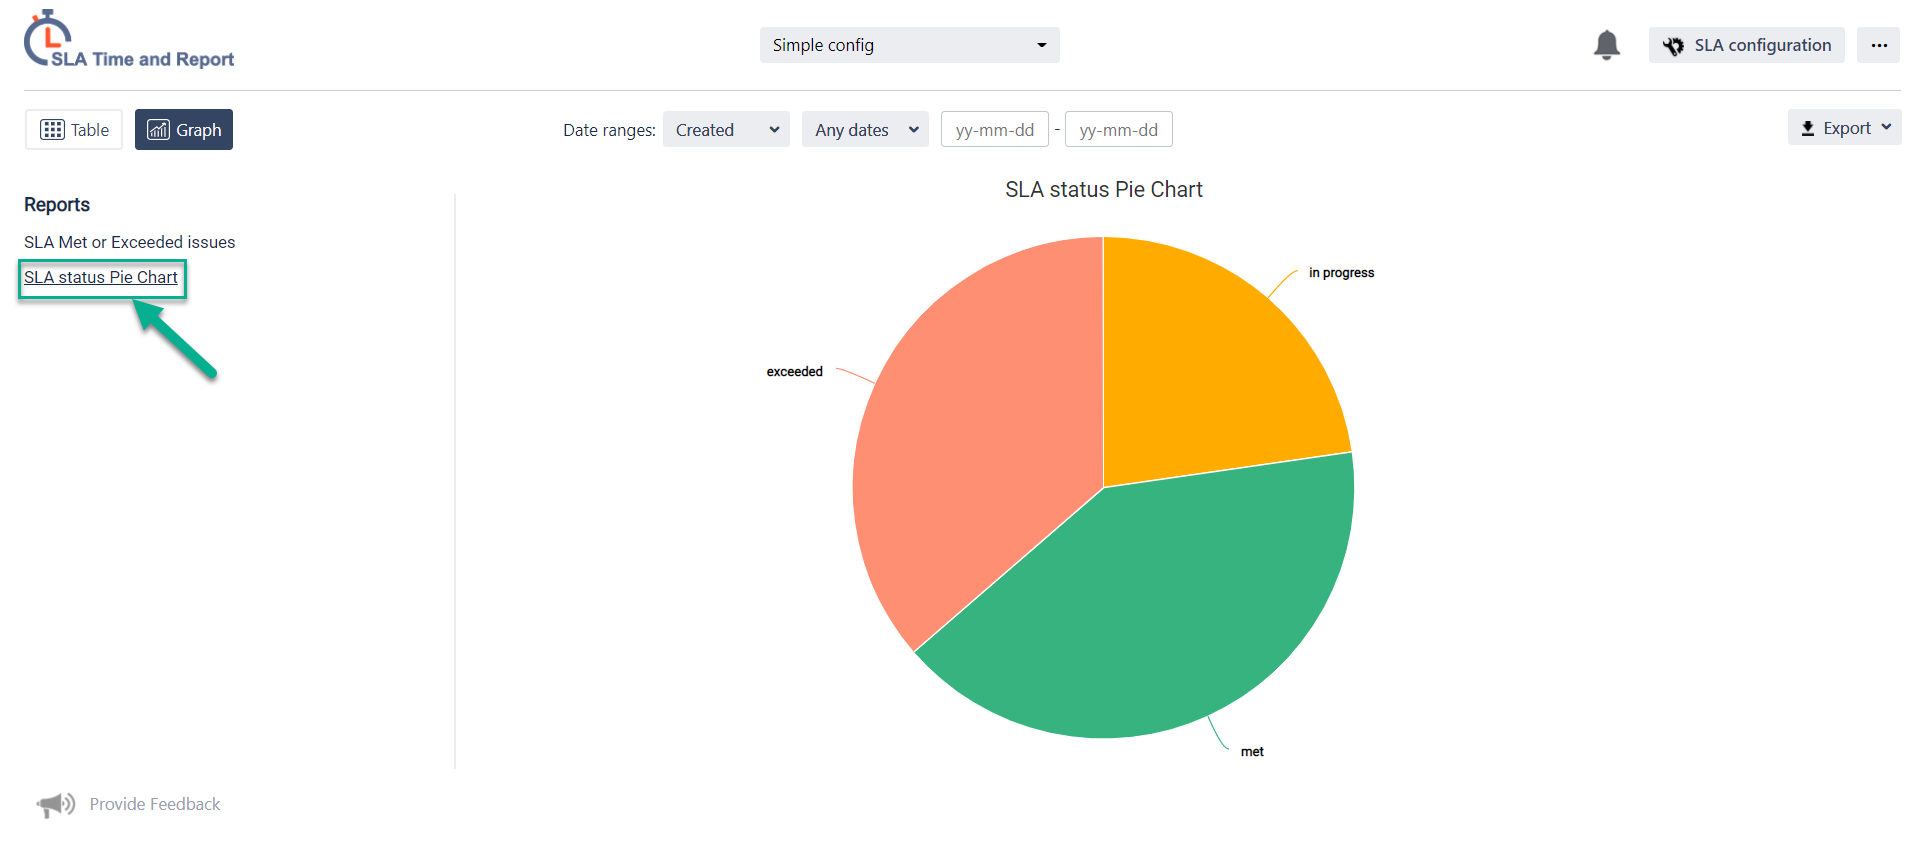
Pie Chart (SLA Met/In Progress/Exceeded)
Line Graphs (SLA Met & Exceeded)
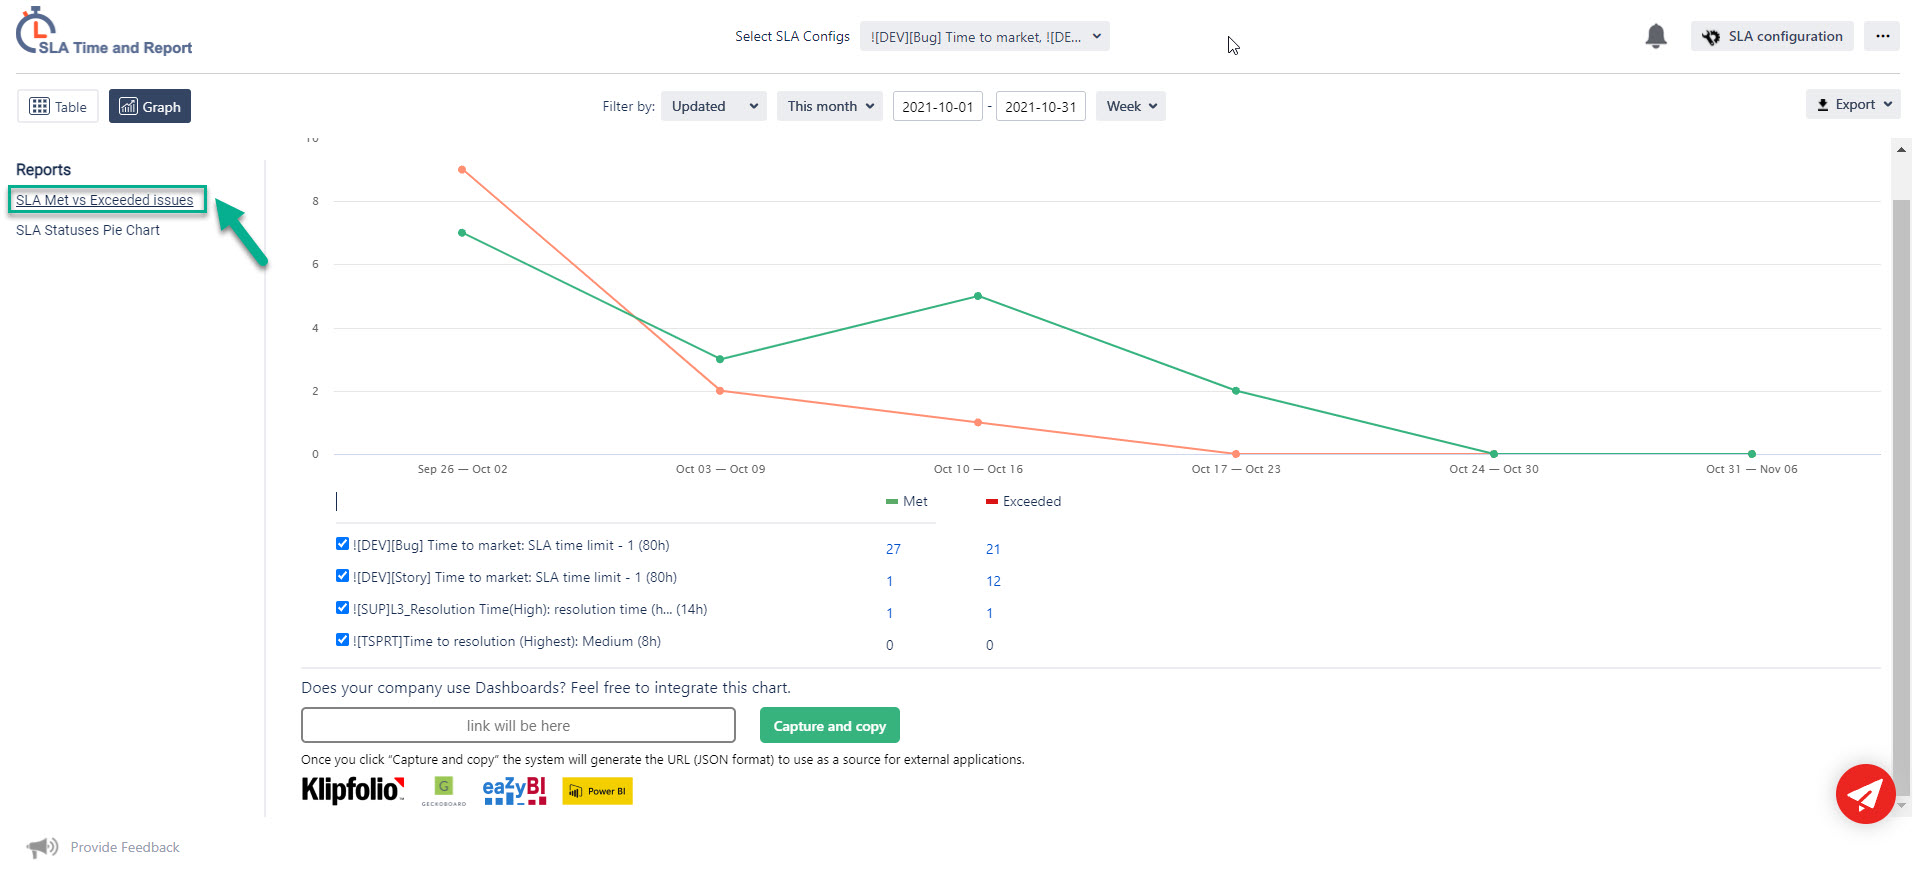
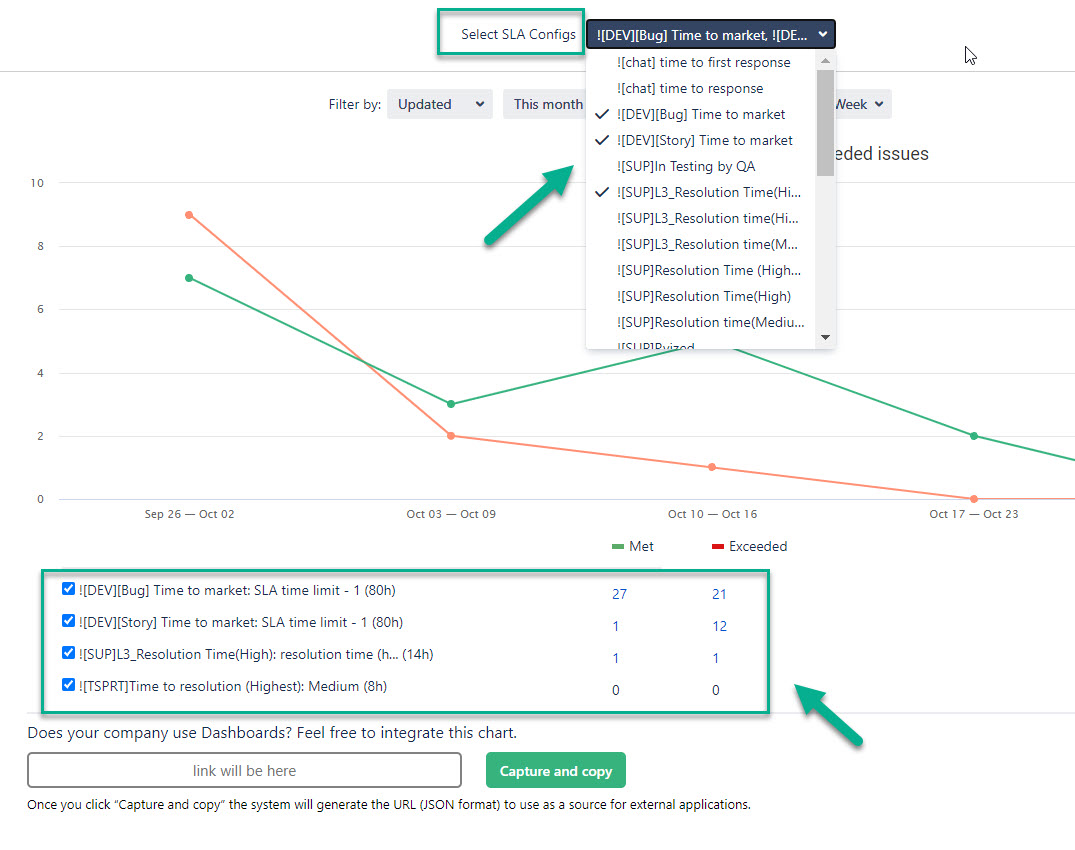
At the Line Graphs (SLA Met & Exceeded) all SLA config’s goals are available.
For this type of chart view, you can use multiselection of SLA configs and view statistic data about each one under graph.
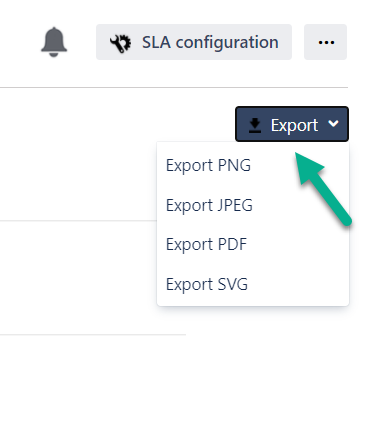
All graphs are available for export in PNG, JPEG, PDF, or SVG format.
Copy JSON URL for any SLA chart and use it as a source for external clip builders (e.g., Klipfolio, Gekoboard) to share it within your organization. Read more about the Capture and Copy feature here.
.jpg?version=1&modificationDate=1613646262267&cacheVersion=1&api=v2&width=510&height=537)
Haven't used this add-on yet, then try it now! >>>