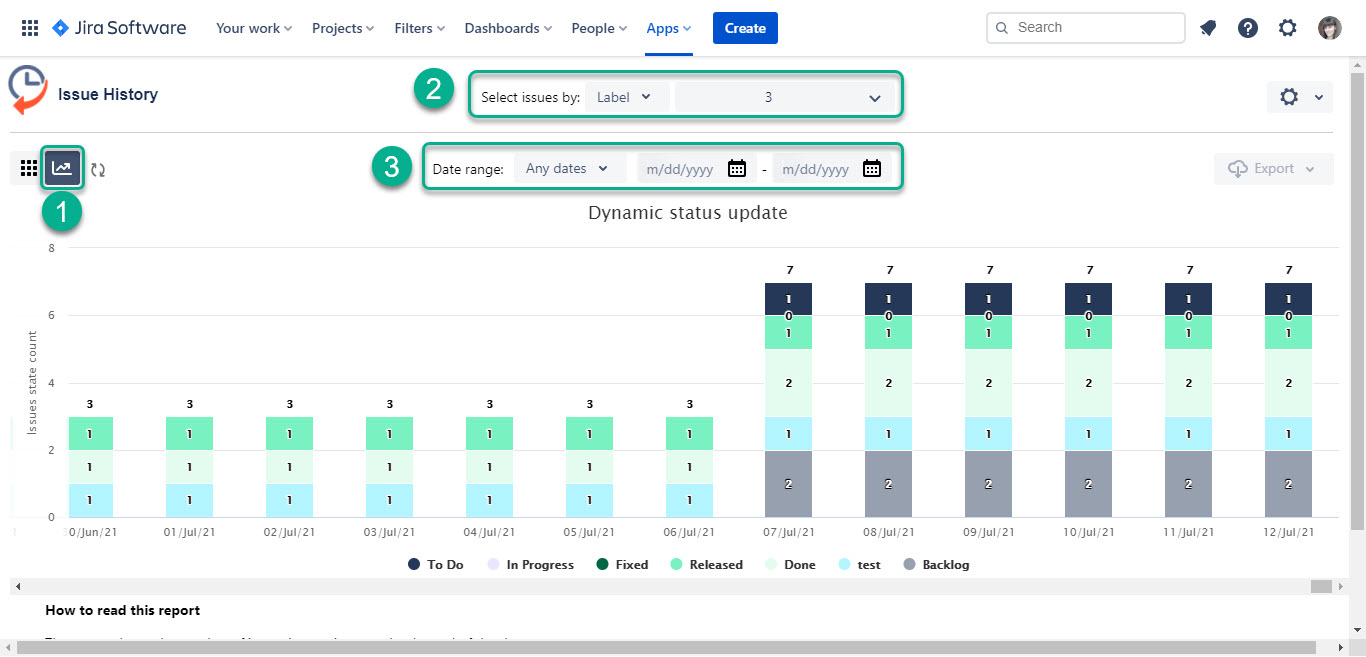
Monitor status updates in bar graph view. You'll get the number of issues at a particular date in a certain status.
Steps to display chart report:
Switch on the chart icon.
Filter the data by Assignee, Filter, Label, Project, Reporter, or Sprint.
Set the required date range.
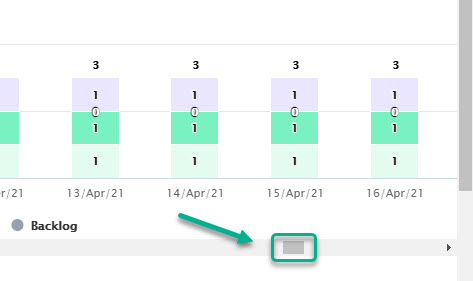
If you have to lay out more than 15 columns, use horizontal scrolling.
How to read the chart report
This report helps to overview the progress your team has demonstrated. The ideal picture is when all issues are in “To Do” on the first day, the further you go the fewer issues should be in the first statuses (“To Do”, “In Progress”, etc.) and more in “Done”. Try to achieve all issues in “Done” on the last day of Sprint.
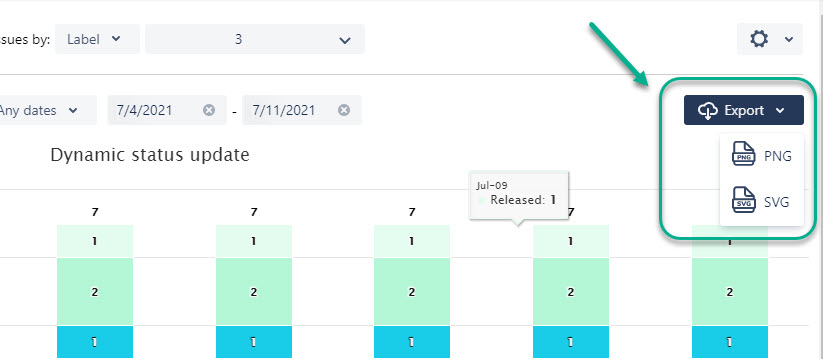
Data Export
You can export the data from the grid as a PNG or SVG file. You can download a report for a period no longer than 3 months.
Haven't used this add-on yet? You’re welcome to try it now >>>