Pivot Table View allows you to use such functions for reports analysis:
Get time for any issues fields, any combination of issues attributes (e.g: Time is status per assignee or Assignee Time per Status).
Manipulate the data by math functions (Average, Min/Max, Median, Count, Sum, etc)
Represent data in numerical or %, etc
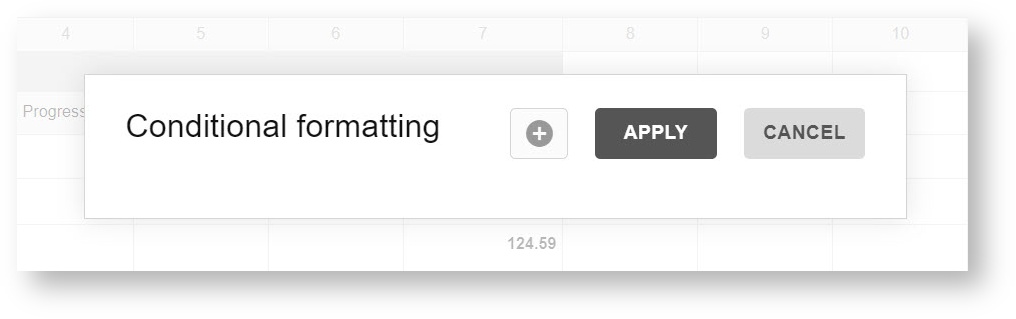
Highlight the cells using Conditional formatting
Sorting and Filtering
Three types of Layouts
Export
Also, you can view Uses Cases when you can use the Pivot Table function.
To get the Pivot Table you just need to tap on its icon in the left-right corner.

As a result, you will get all types of Time in status for Jira Cloud app reports data with Pivot Table functions.

The main features of this reports view are Fields, Options, Format, and Export.
Fields option
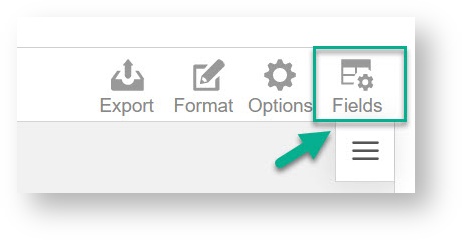
It lets configure Reports Filters, Columns, Rows, and Values according to your Jira issues fields.
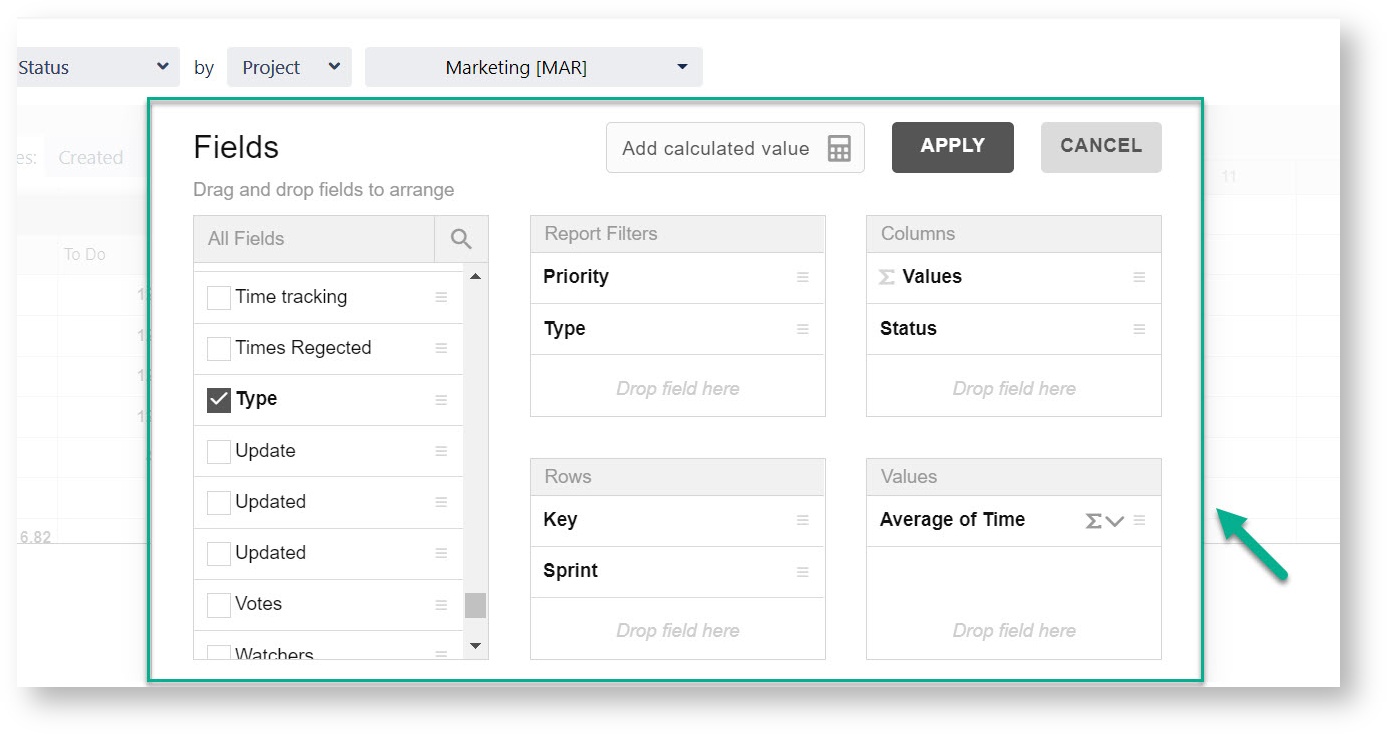
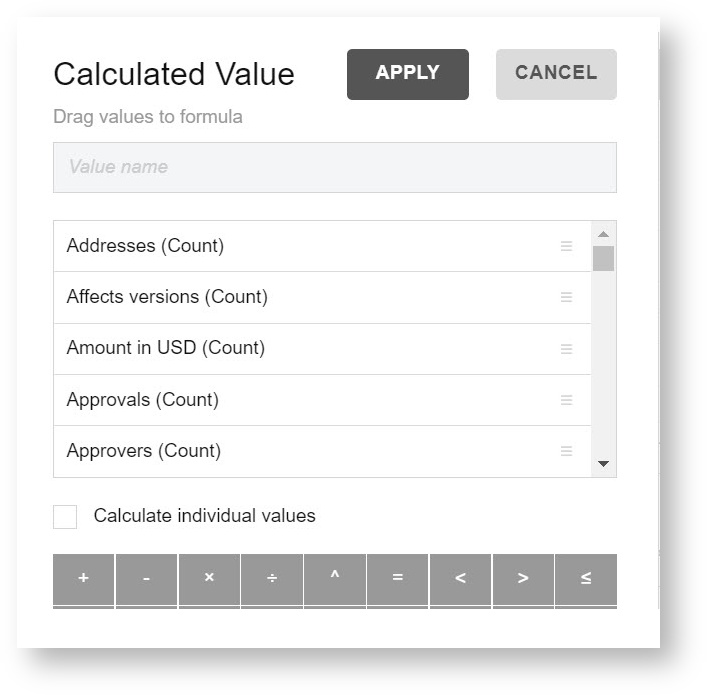
You can also add calculated values to Pivot table data.
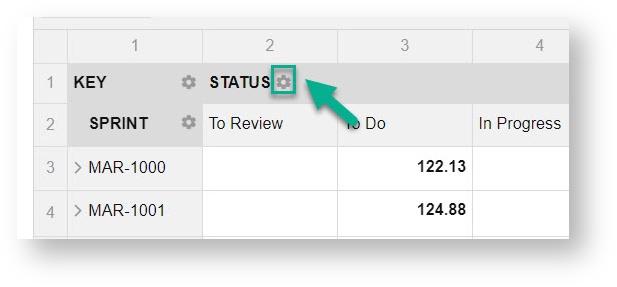
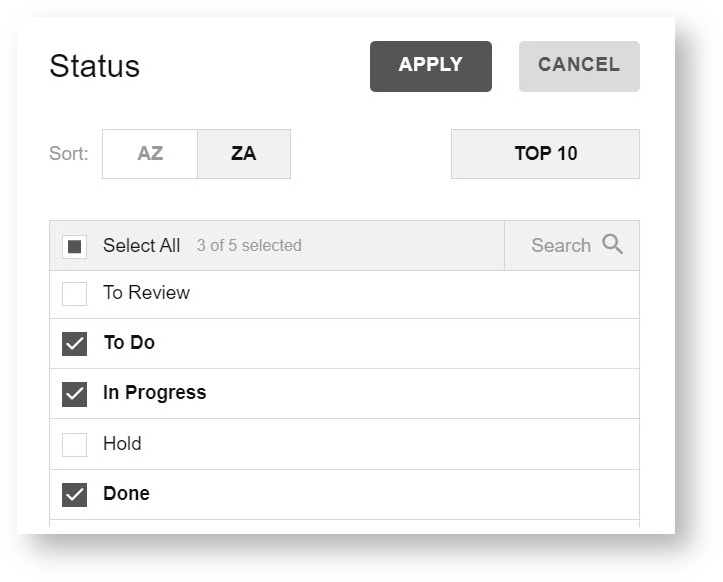
On the Pivot table you can filter data by each selected Field. To do it click on gear near them.
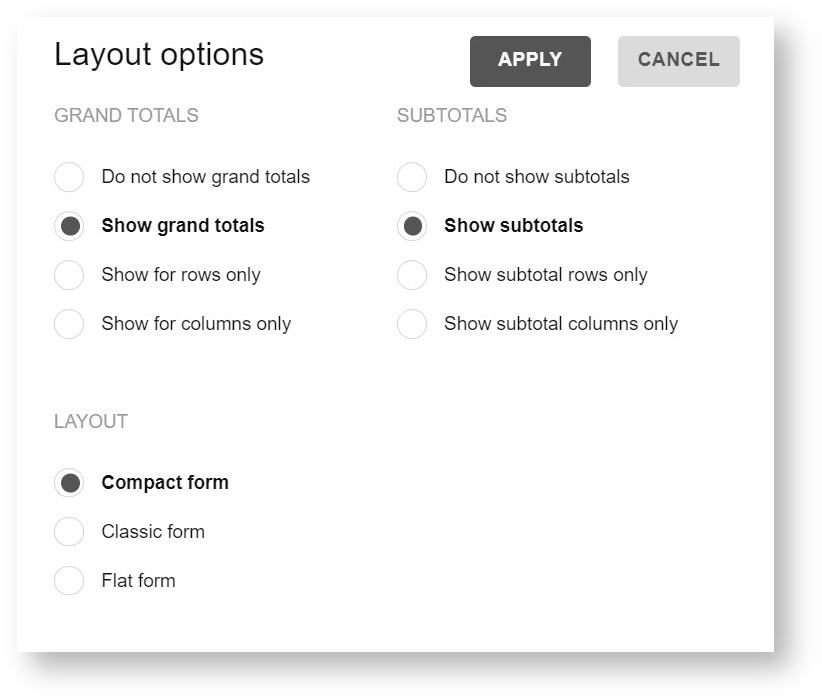
Layout options
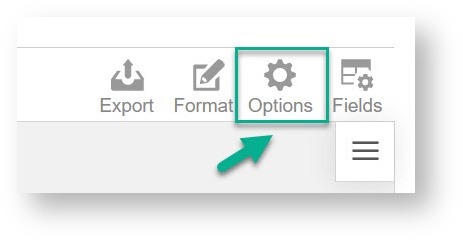
At the Layout options, you can set Subtotals and Grand totals.
Format
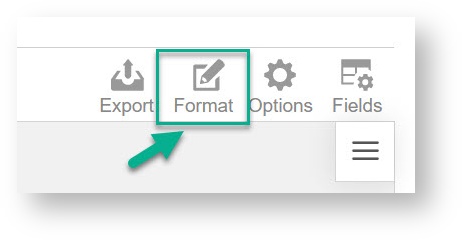
The format option allows configuring Cells Format, such as value, text-align, decimal places and etc.
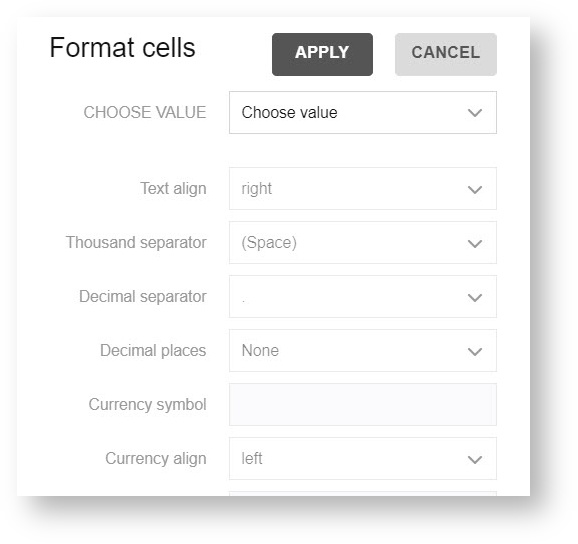
Also here in the Format drop-down, you can select conditional formatting.
Export
You can print and export your custom configured Pivot table with Time in Status for Jira Cloud data to PDF, Excel, or HTML formats.
