Smart view feature was developed to help you visually differentiate the calculated values in the grid. The numbers will be highlighted from the min to the max, so you will promptly distinguish all of the variations.
Highlighting is available for all reports, except the Status Entrance Date.
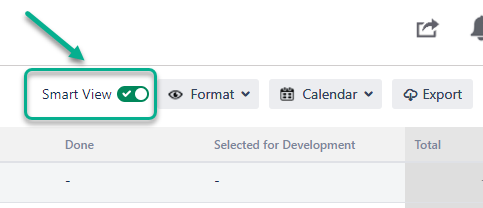
To activate the function, switch on the “Smart view” toggle button.
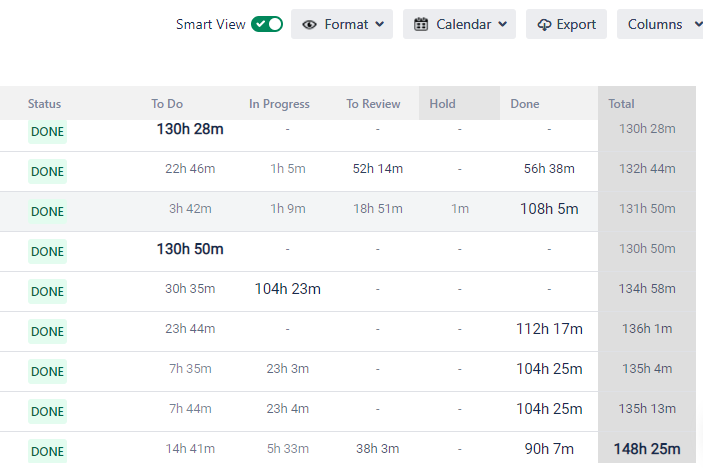
As a result, you’ll get a report with a gradation of highlighted figures for the page you see. The smallest values will be slightly visible, and the highest ones – bold and enlarged.

The gradation scale includes following parameters:
Text color is based on the level of text saturation.
Text boldness will be applied for maximum values.
Text size will enlarge with increasing values.
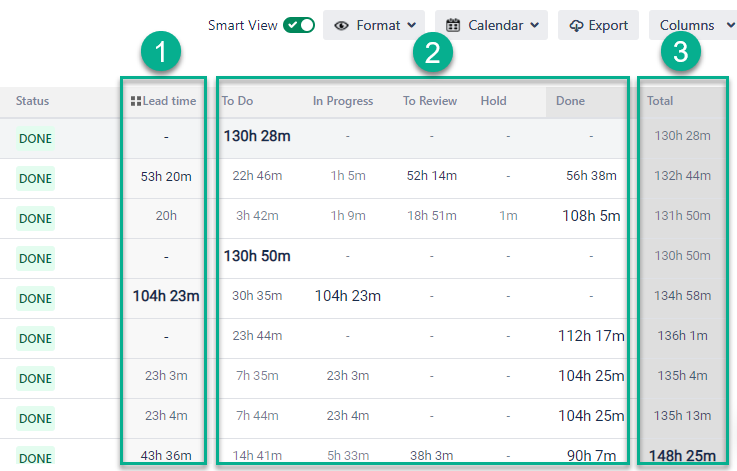
Ranges on values, totals and groups will be defined separately:
Range within the status groups – separately for each
Range for all statuses
Range within the total

If you need help or want to ask questions, please contact SaaSJet Support or email us at support@saasjet.atlassian.net
| Info |
|---|
Haven't used this add-on yet? Try it now >>> |