You can view and compare assignee status timestatus time data in averages or percentage values. To do it, you need to use Pivot table View in Time in Status for Jira Cloud.
1. Open a Time in Status for Jira Cloud app.
2. Select a Pivot Table view.
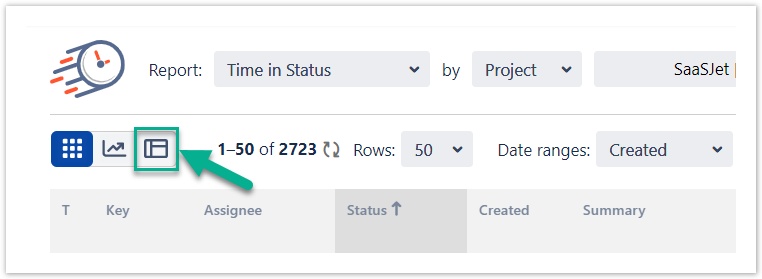
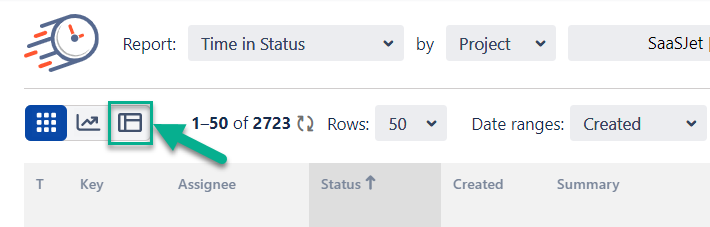
3. Then click the Field button.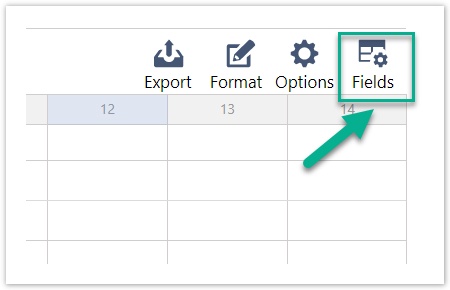
...
4. In the Field menu, you can customize data presentation by settings your custom fields for Rows, Columns, Report Filters.
To get the Average status time for assignees, drag and drop such fields:
Assignee field → Rows,
Status field → Columns
Time (hours) → Values
...
5. To get average time data, select the Average option in the Values drop-down menu.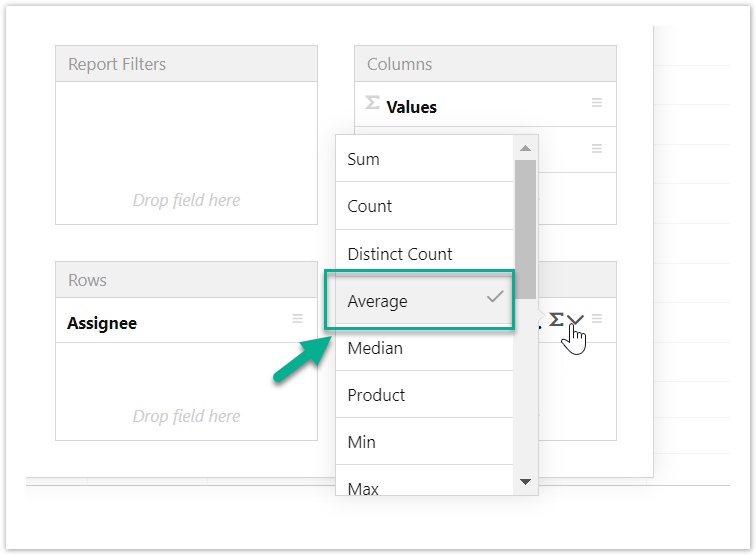
...
As a result, you will get the Average time in status for each assignee. 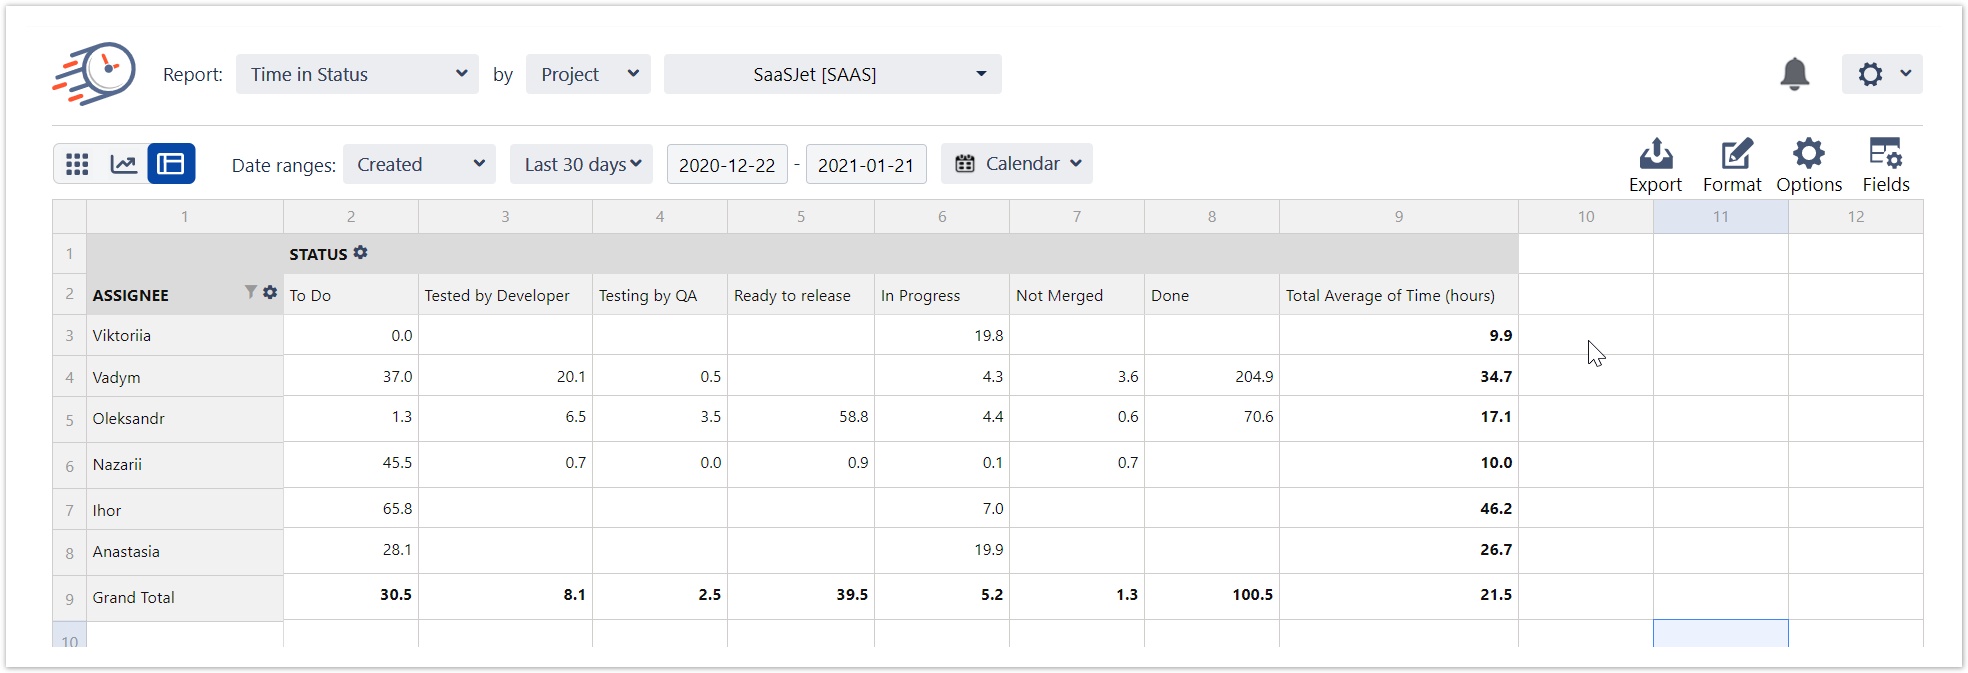
...
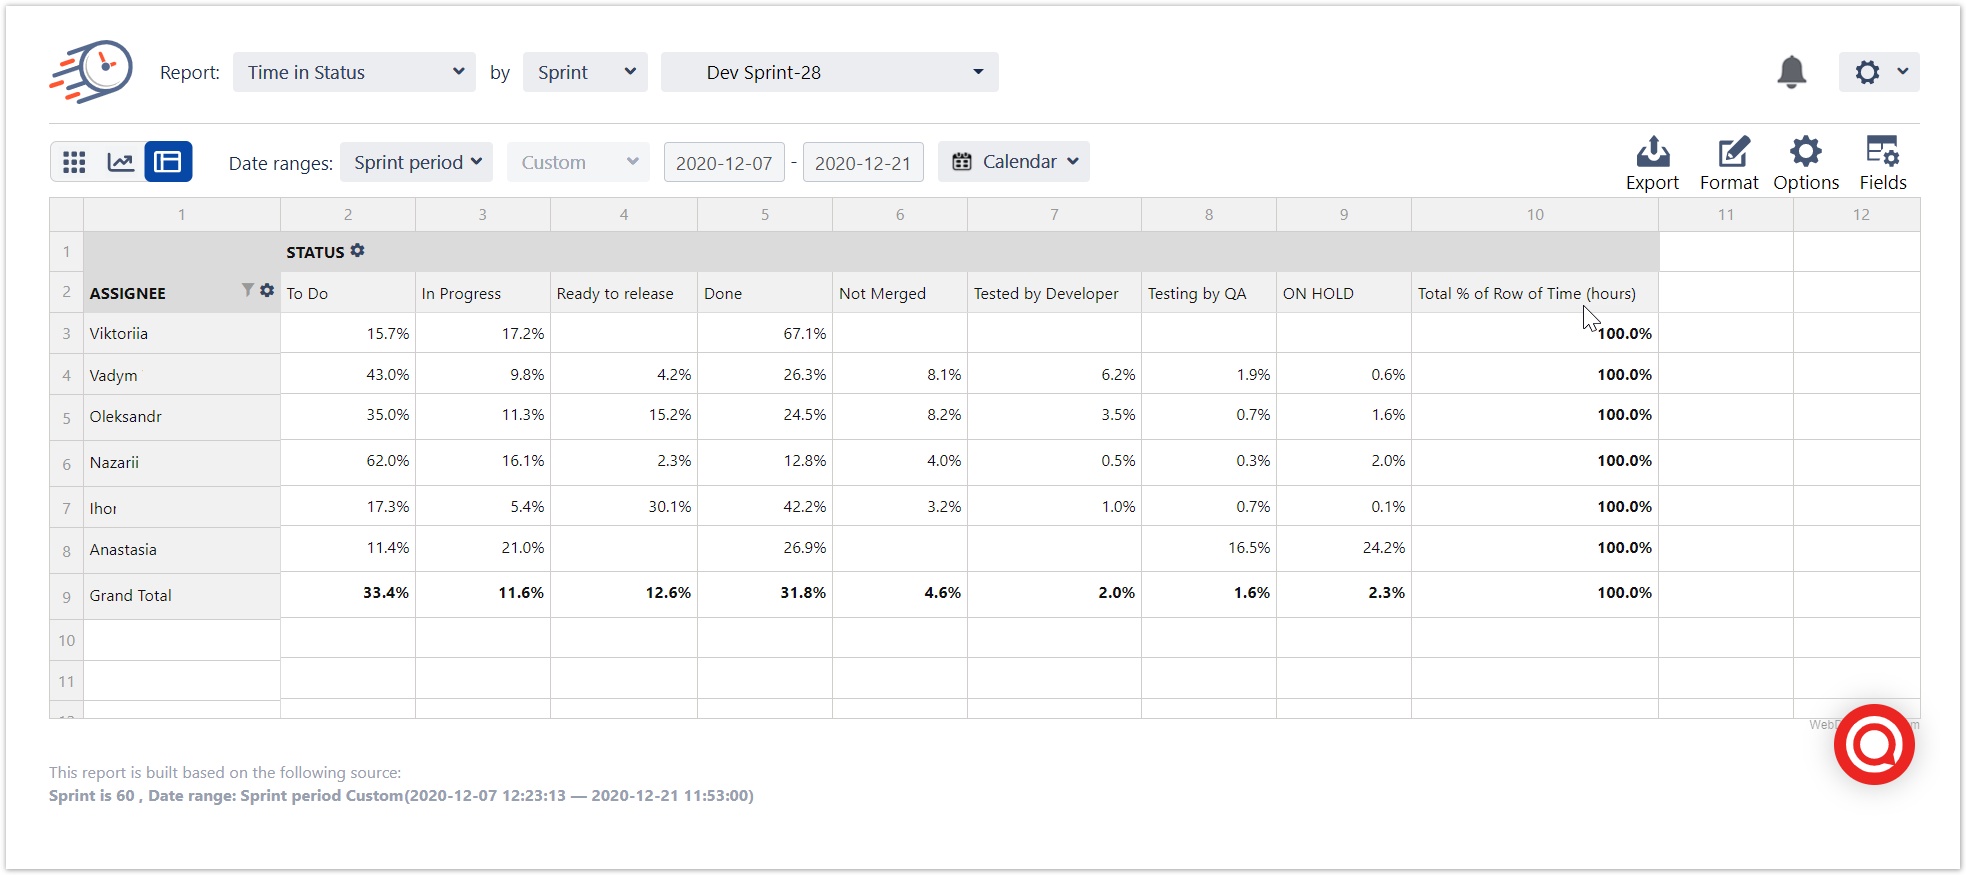
When you have changed Time Value to % of Rows or Columns, you will get the report with the Average time in percentages. 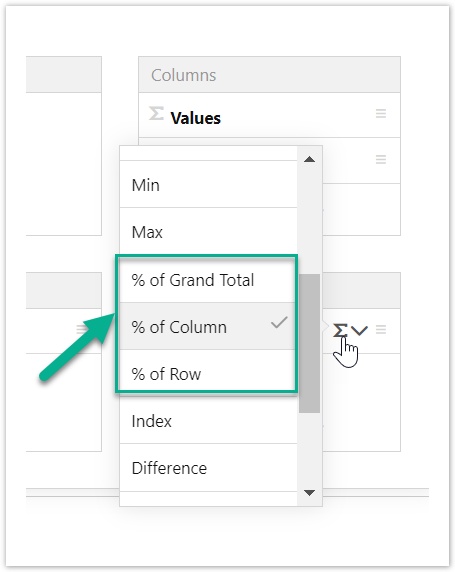
...
 .
.
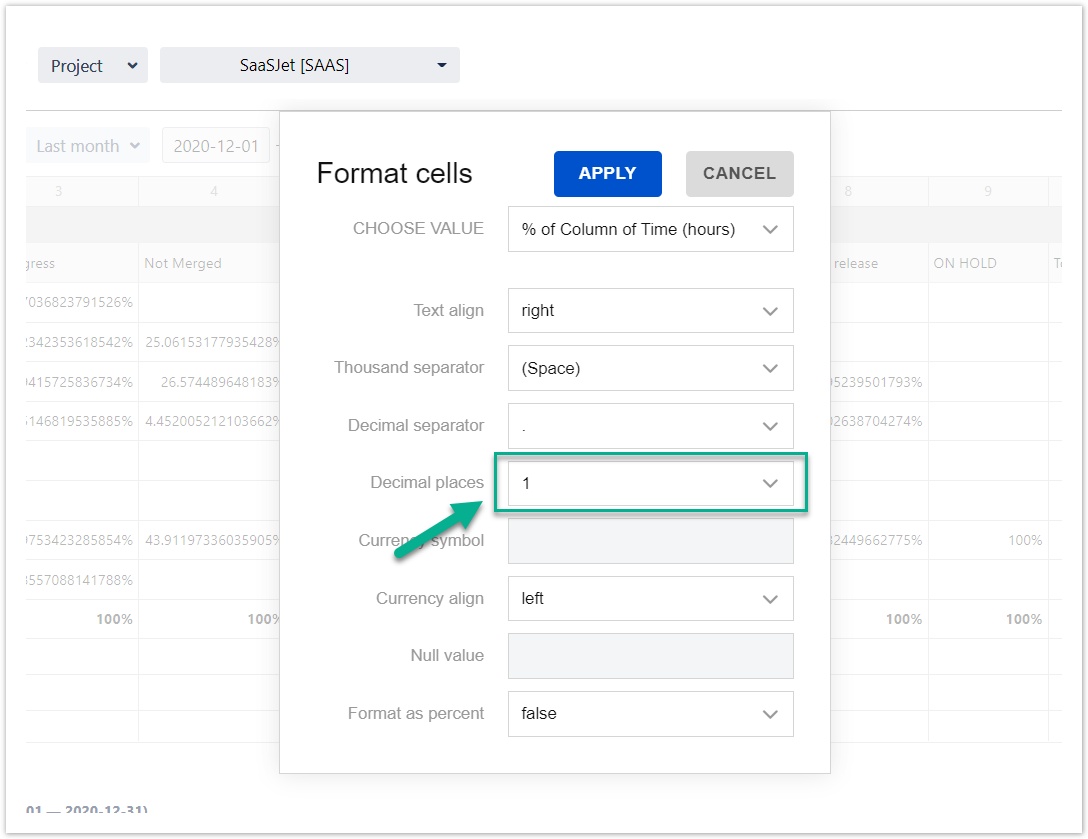
In Format menu, you can change the data format.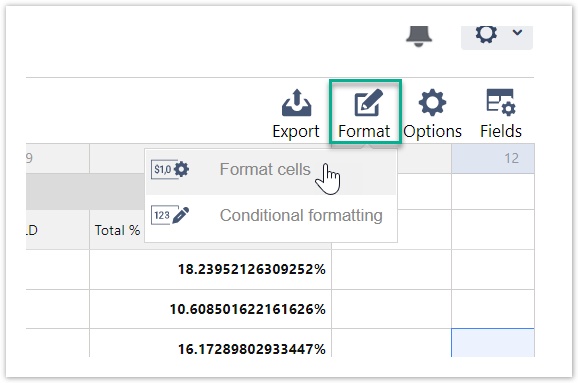
...
Also, you can use additional settings for report issue list selection.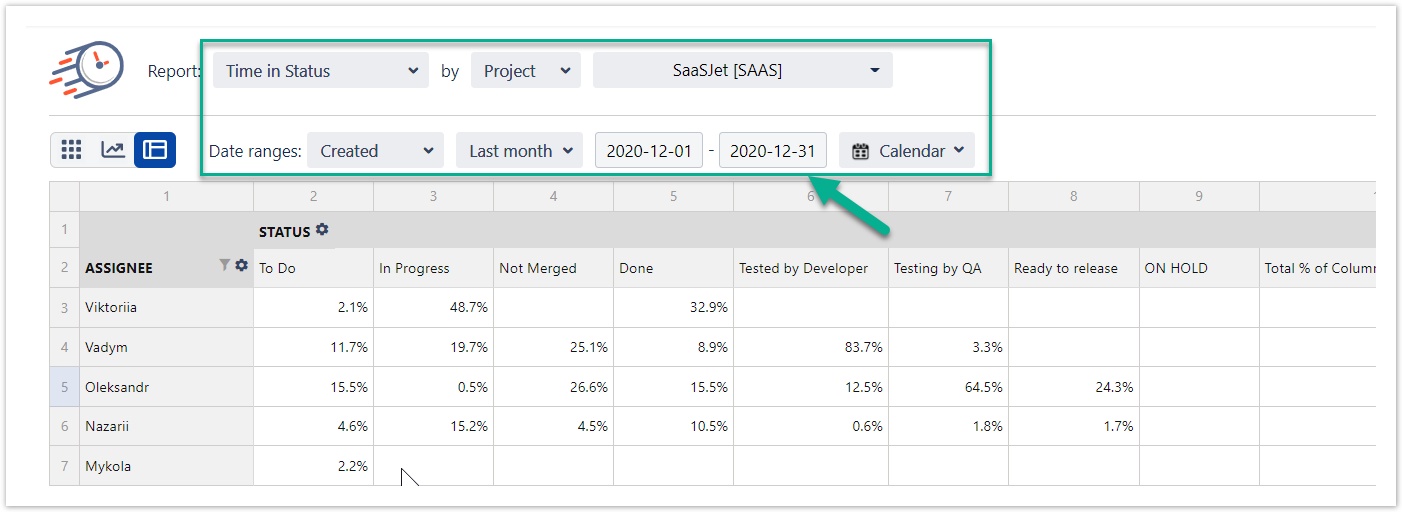
...
You can Export the customized report to Excel doc or PDF format.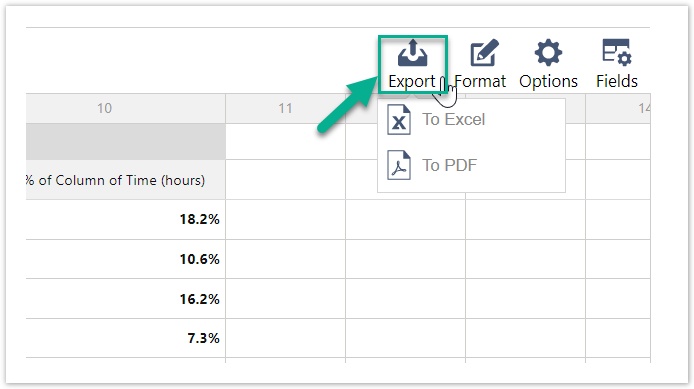
...
| Widget Connector | |||||
|---|---|---|---|---|---|
|
...
|
...
| Info |
|---|
If you need help or want to ask questions, please contact SaaSJet Support or email us at support@saasjet.atlassian.net |
| Info | icon | false
|---|
| Tip |
Haven't used this add-on yet? Try it now! >>> |