1.
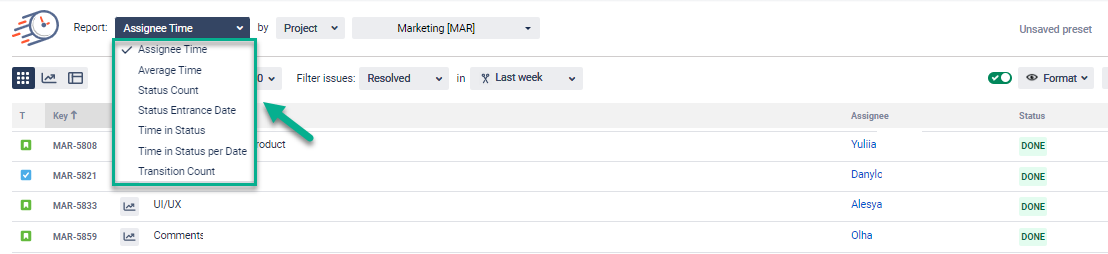
ChooseSelect the
reportreport type
Choose the report you want to generate (see the list of reports).
2. Filter the data
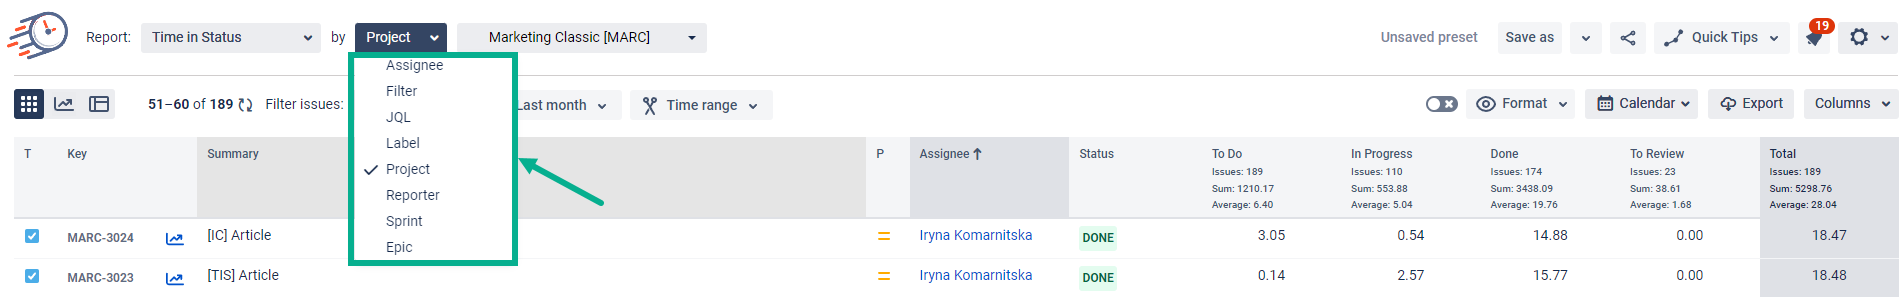
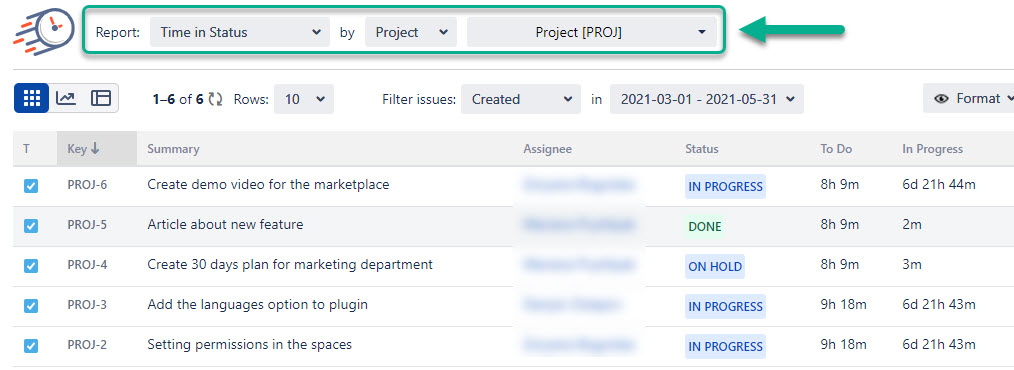
When generating the reports, you can filter can filter data by:
Assignee
Filter
Label
Project
Reporter
Sprint
JQL
Epic
.png?version=1&modificationDate=1655389979345&cacheVersion=1&api=v2&width=680)
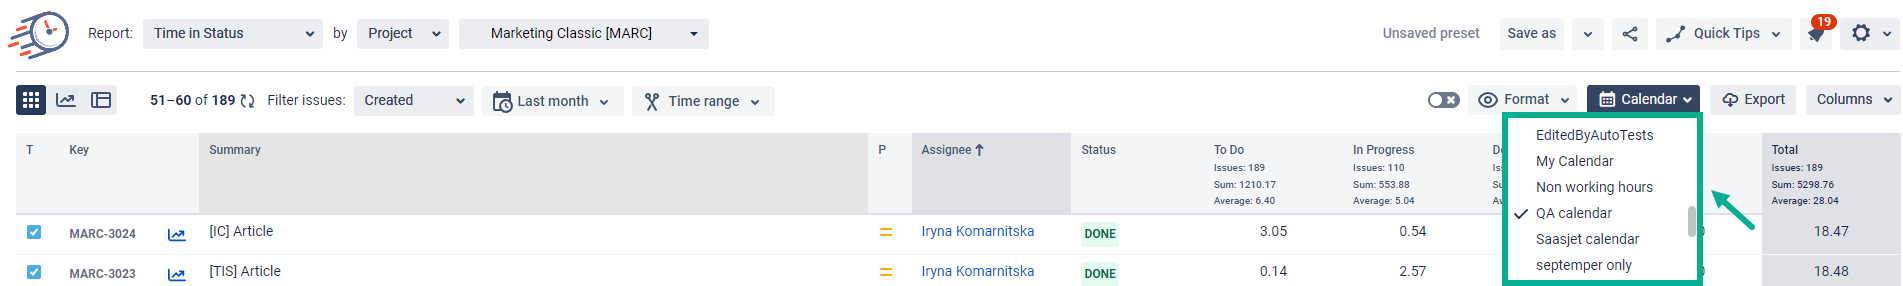
3. Choose a Calendar
Select a necessary Calendar to Calendar to generate data. There, you can choose a custom calendar you've added previously or a default 24/7 one.
.png?version=1&modificationDate=1655389999148&cacheVersion=1&api=v2&width=544)
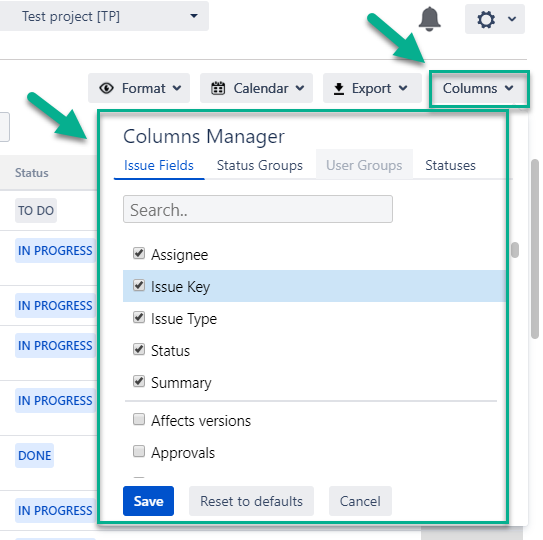
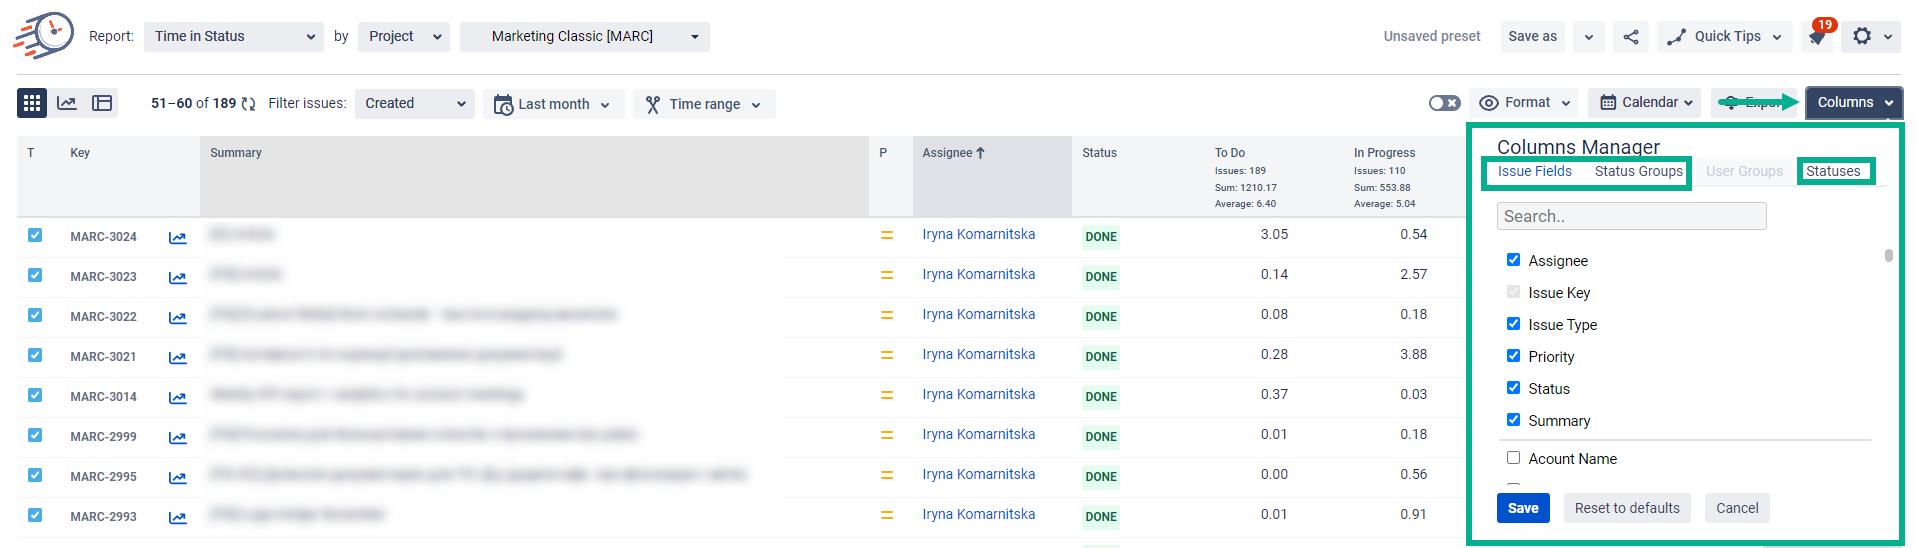
4. Column Manager
In the Column manager, you can manage the Issue Fields, Status Groups (read more about Status Groups), User Groups (read more about User Groups) and Statuses.
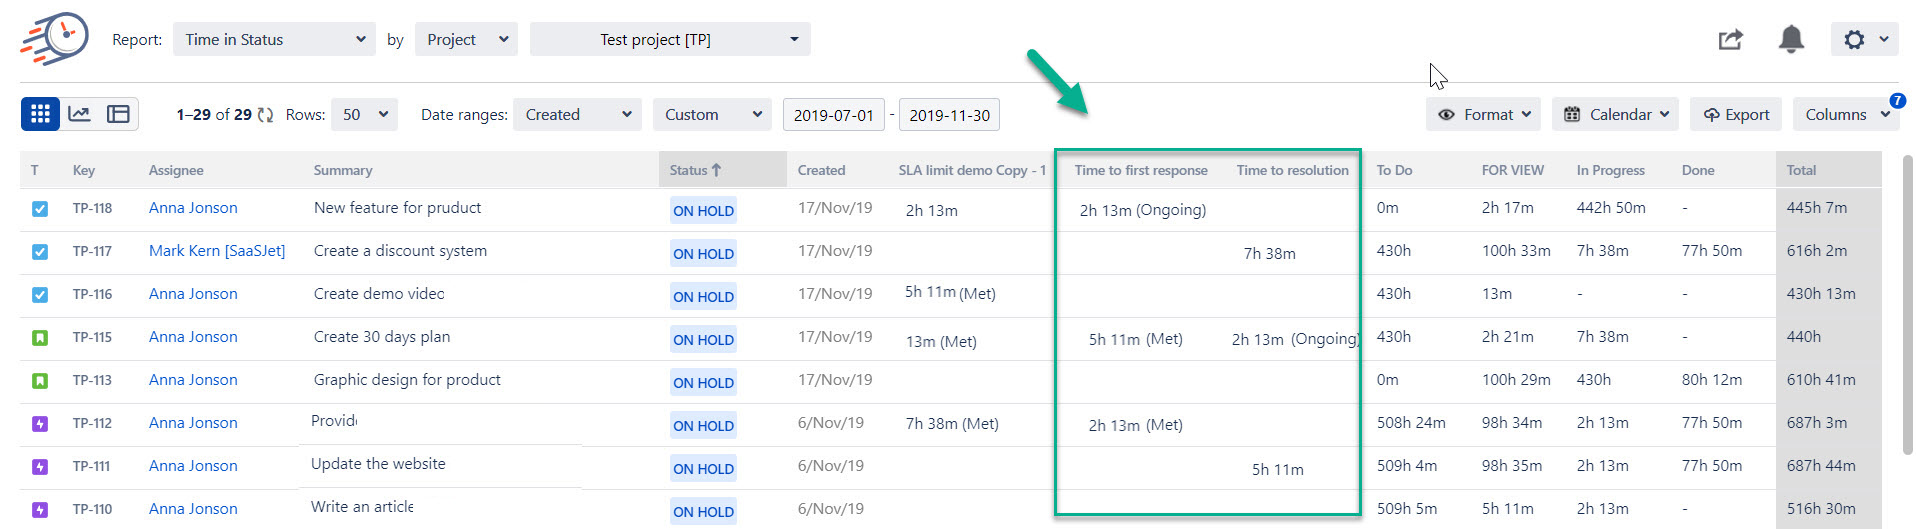
5. Adding SLA Column
First of all, you need to click “Issue Fields” to get a drop-down list with all available issue fields.
Choose the necessary SLA (Time to Response, Time to First Response, Time to Resolution, Time to Resolution (Roadmap). Or choose all of them. Click a "Save" button.
.png?version=1&modificationDate=1655455749347&cacheVersion=1&api=v2&width=340)
2. Get all necessary columns with SLA data to generate a report.
 6.
6. 
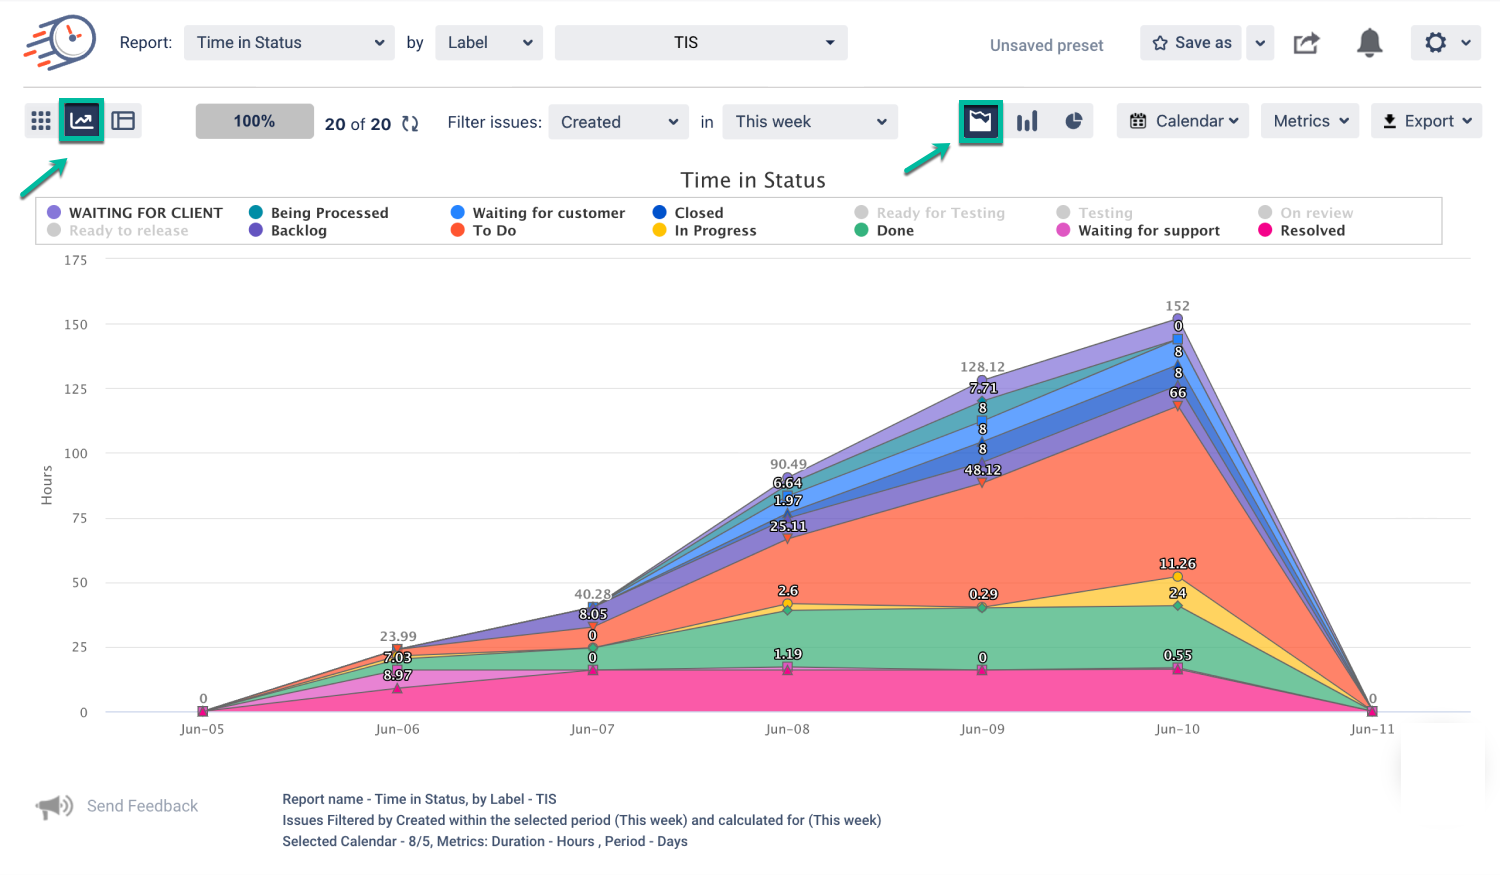
5. Chart Reports
All reports are available as Grid and Charts.
Three types of graphs are available: Pie, Bar and Area Charts.
For more information, visit Chart Reports View.
 7
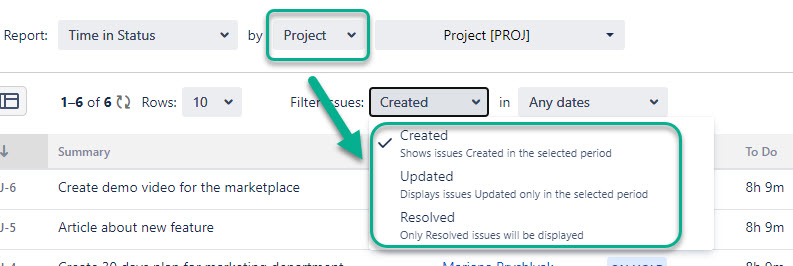
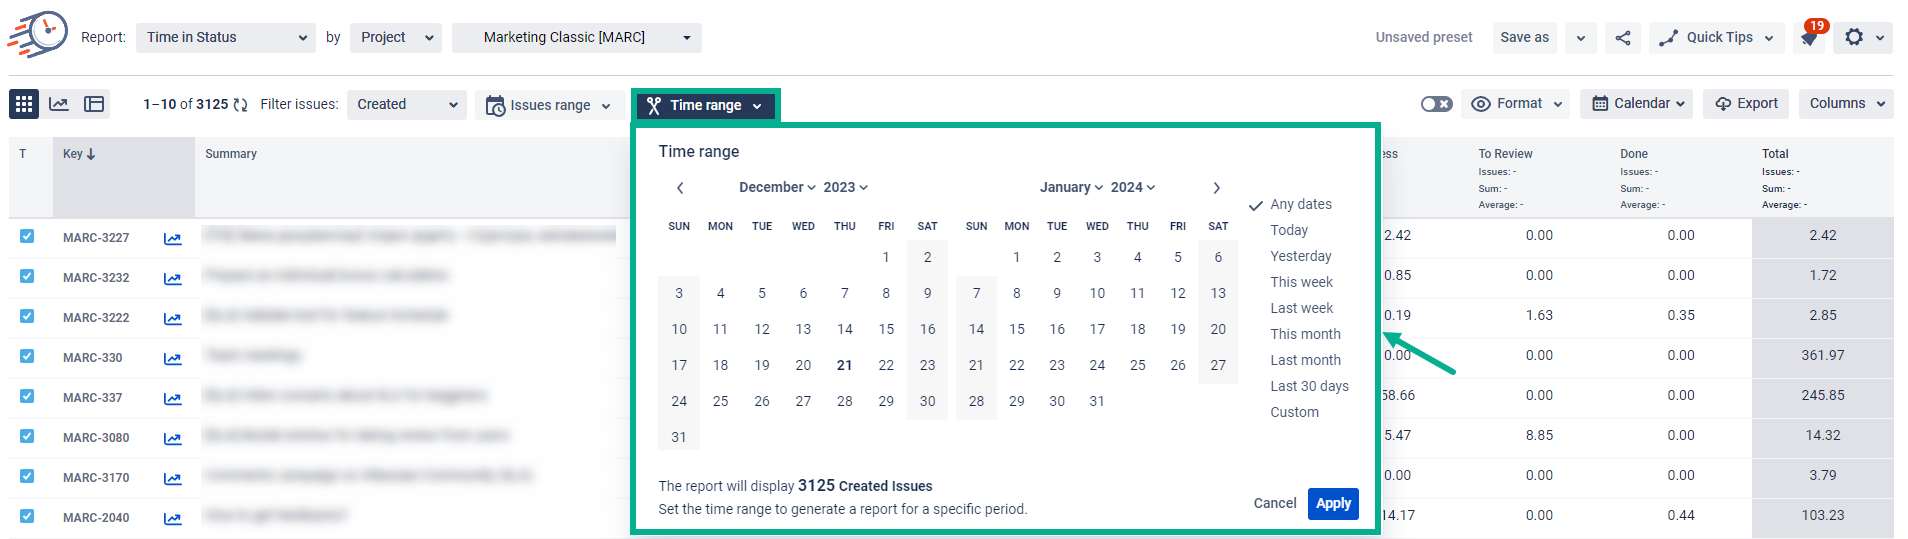
76. Filtering issues
Use the Filter issues functionality to customize report timeframes.
 From
From 
You can select three date ranges from the drop-down list , you can select three date ranges that allow that allows sorting issues depending on the dates of creating, updating, or solving issues.
Created
Updated
Resolved
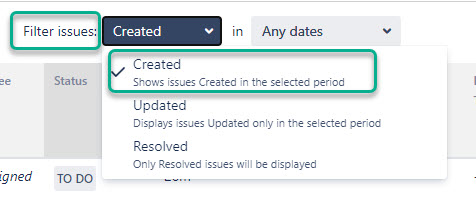
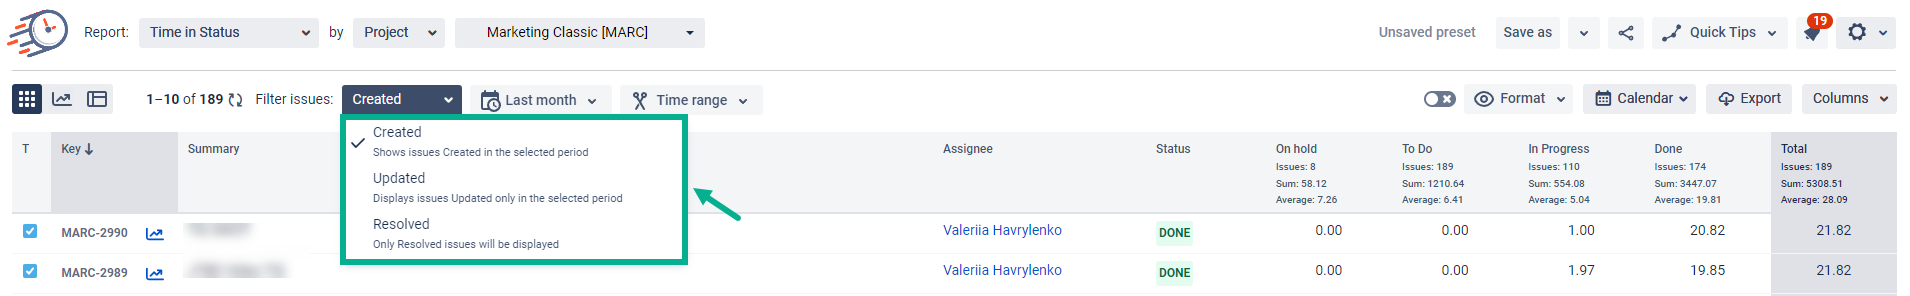
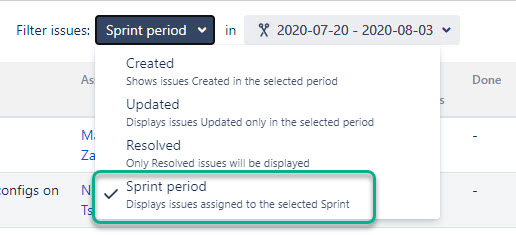
In case If you have filtered the issue list by sprint, you can select the date period according to the sprint period.
Useful tips show the detailed info of what each of the ranges means.
In case,! Note that if you have filtered by "Sprint", you'll get 4 types of ranges for filtering issues.
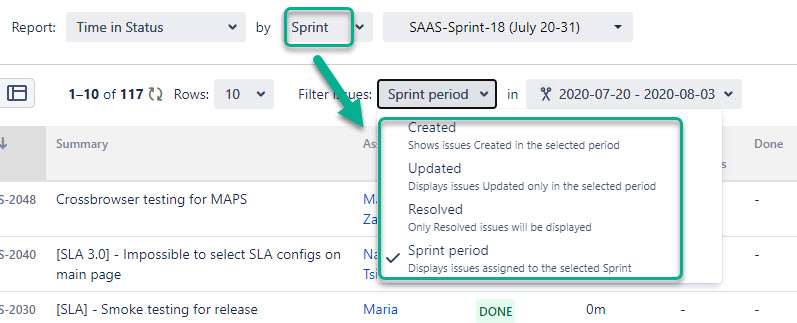
In case, you have filtered by " Project", you'll get 3 types of ranges.
Then Then, you can choose the period for in which you want to get the report.
By clicking Any dates, you’ll get 2 calendars displayed on a screen.
Issues periodrange – to select issues Created, Updated, or Resolved during the required period.
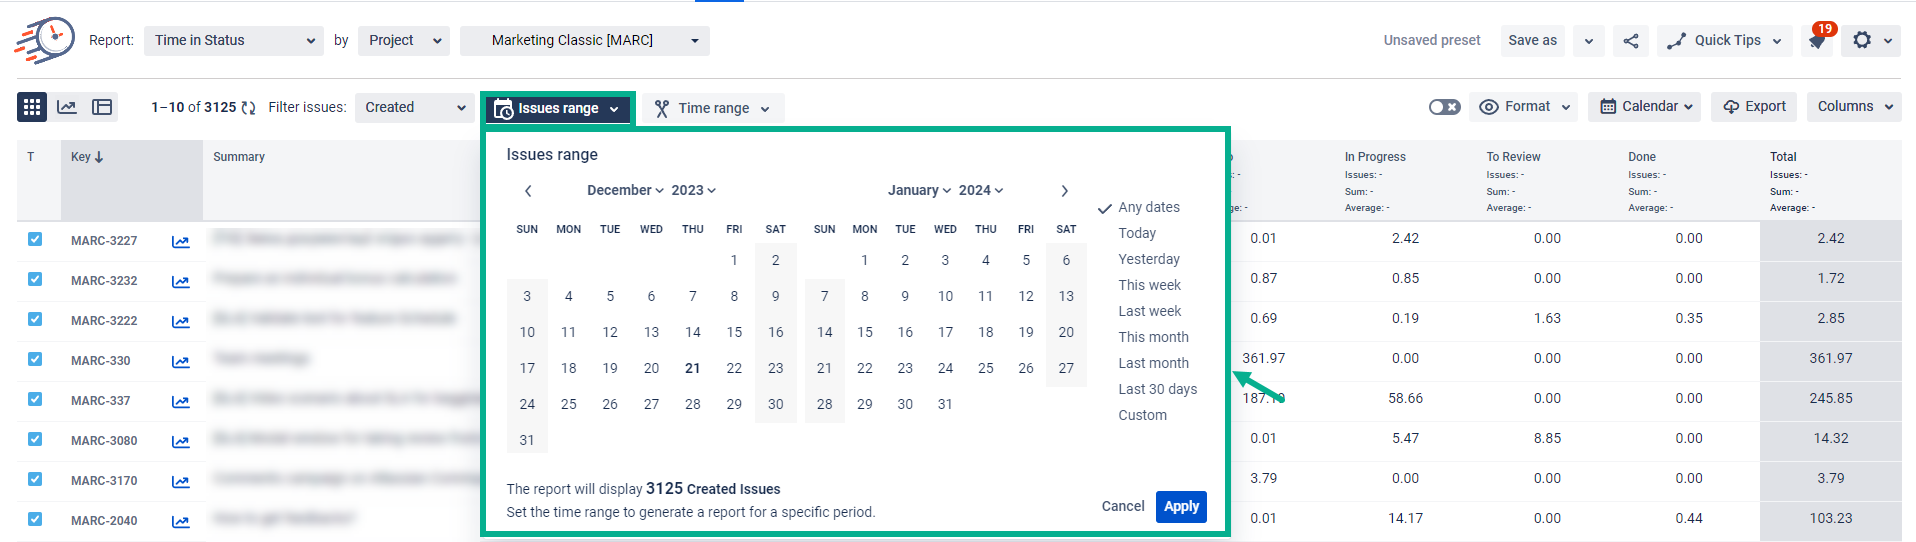
Time reporting periodrange – to get issues for a specific date or date range without taking into consideration considering creating, updating, or resolving.
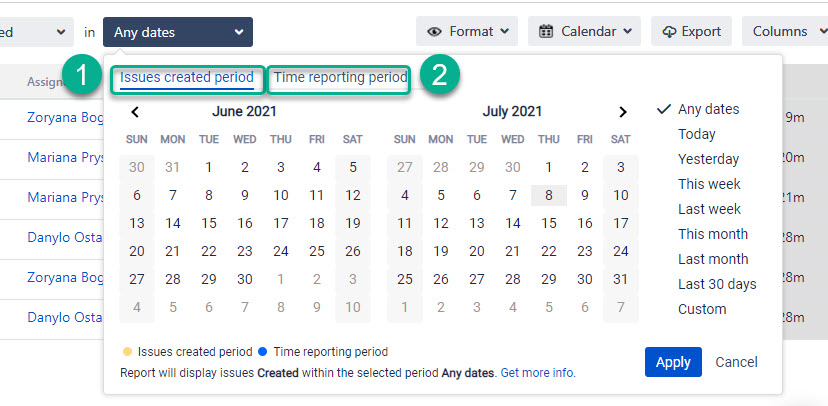
Read more inIssues and Time Range Periods section.
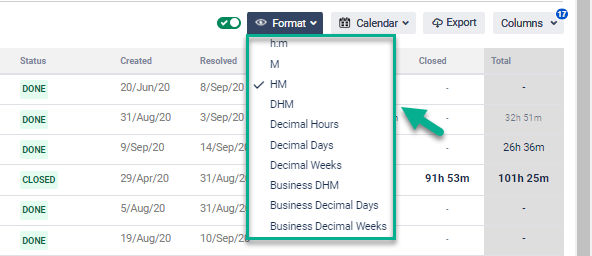
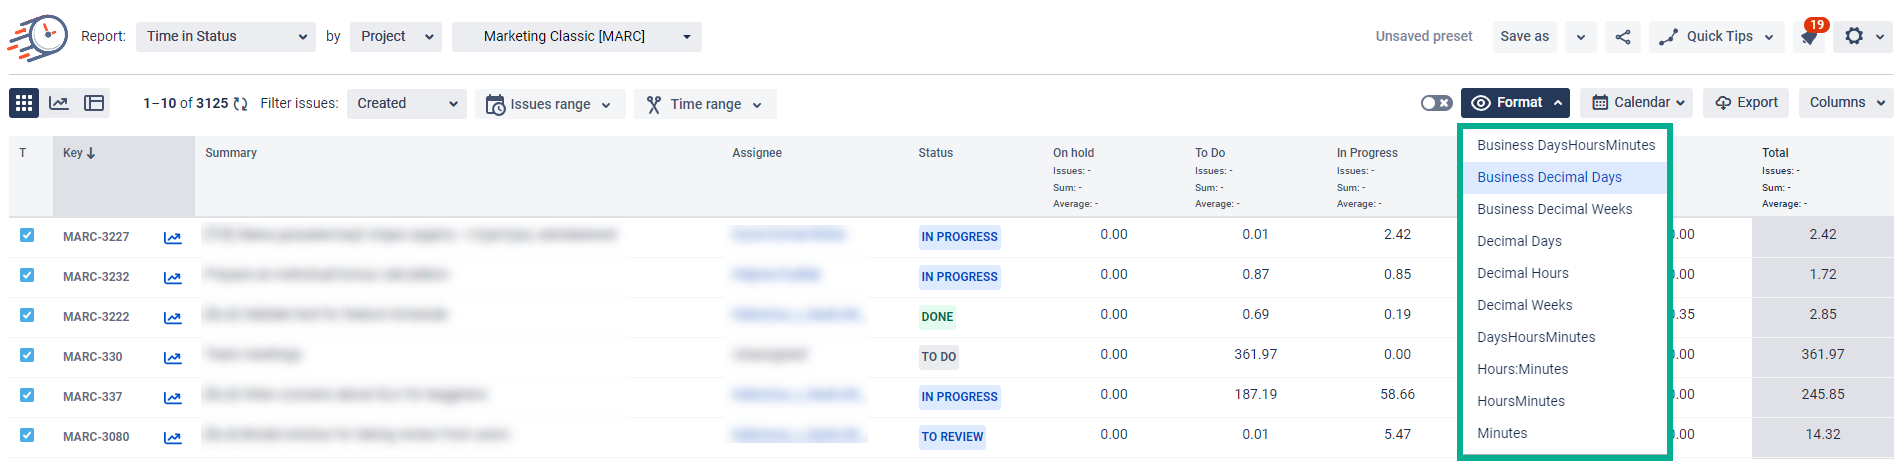
87. Choose a Time format
The Format option lets you select the time format of how the status duration will be displayed:
DHM (Days, Hours, Minutes)
HM (Hours, Minutes)
h:m (hours:minutes)
M (Minutes)Minutes
HoursMinutes
Hours:Minutes
DaysHoursMinutes
Decimal Weeks
Decimal Hours
Decimal Days
Business Decimal WeeksBusiness DHM,
Business Decimal Days,
Business Decimal WeeksDaysHoursMinutes
Learn more > Time format.
| Info |
|---|
NoteTo extract data for analysis, please choose one of the Decimal time formats (Decimal Hours, Decimal Days or Decimal Weeks). It will enable you to perform calculations on the exported data and build charts. Business DHM, Business Decimal Days and Business Decimal Weeks formats show data according to your determined business days. |
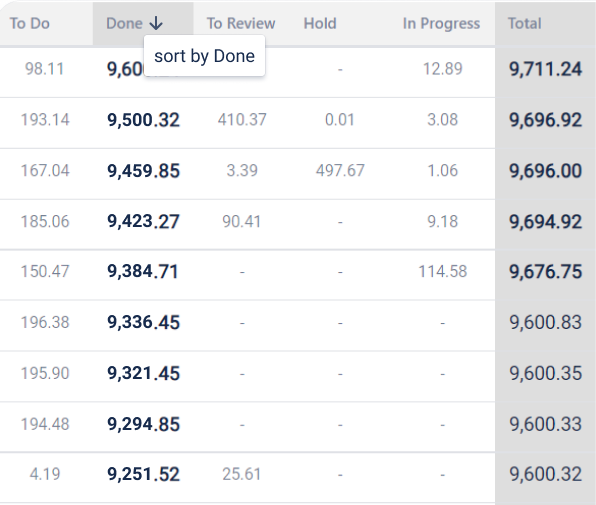
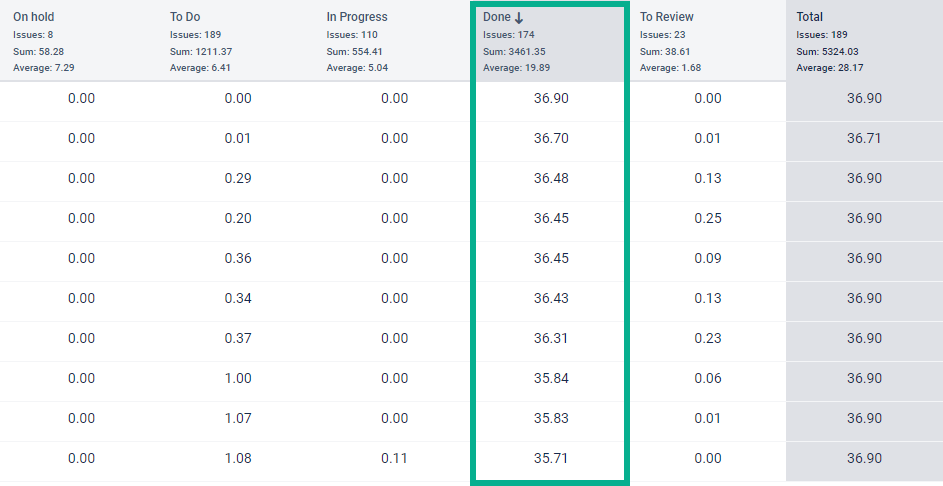
8. Sorting data
Click the column to sort the values in descending or ascending order. You can sort any column, including Jira fields and calculation data.
Sorting data is available for all reports based on issues or assignees.
 10
109. Share reports
Click the Share button to create and copy the link for sharing with your team.


| Panel | ||||||||
|---|---|---|---|---|---|---|---|---|
| ||||||||
| Info |
|---|
If you need help or want to ask questions, please contact SaaSJet Support or email us at support@saasjet.atlassian.net |
| Tip |
|---|
Haven’t worked with the add-on yet? Give it a try⬇ |