You can view the average time data for the assignee you are interested in. To get it, you need to do such steps:
- Open Time in Status for Jira Cloud app
- Select the Average Report type

3. Choose the Assignee option in the drop-down filtering menu

4. Specify the Assignee name for data analyzing.

5. As a result, you will get the Average Time report for a particular assignee in the issue list view. 
Grid Metrics

You can change the Date/Period to Hourly, Weekly, Daily, Monthly, Quarterly

Chart view
Also, you can monitor the average time for assignee data in the graph view.
Click on the chart icon in the left corner

There are 3 types of charts available for you.


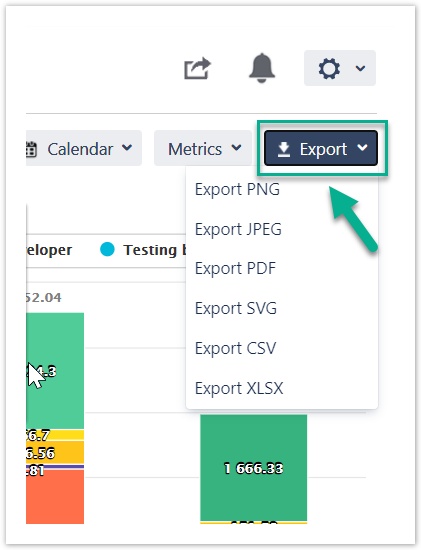
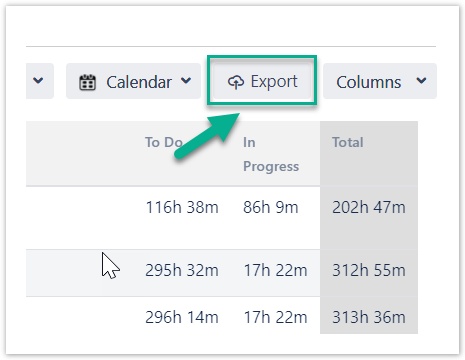
To save data, you need to use the export function. Both chart and tablet data are available for exporting.
If you need help or want to ask questions, please contact SaaSJet Support or email us at support@saasjet.atlassian.net