Welcome!
The description below will help you to learn more about all the features of the application SLA Time and Report.
We've prepared this short video to walk you through the updates!
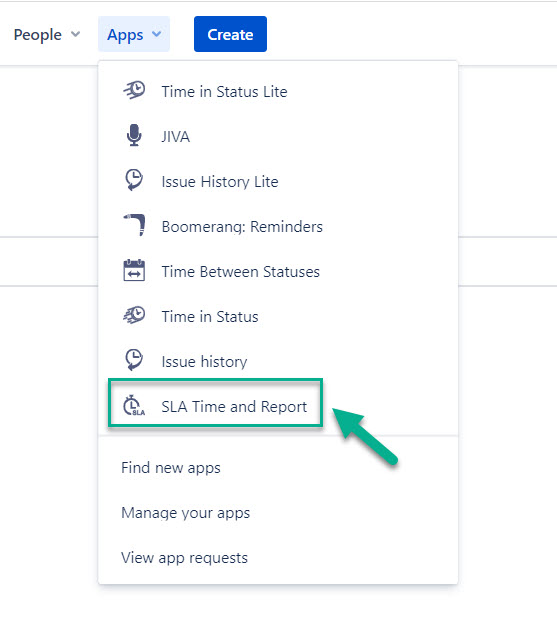
1. Go to the installed add-on
First of all, find the installed "SLA Time and Report" add-on below Jira settings menu item. Click on it to enter.
If you use the old Jira view window.
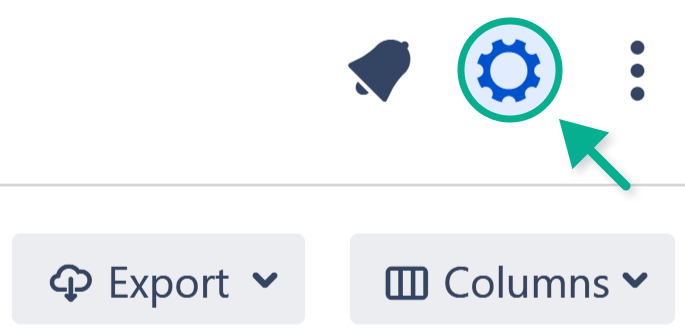
2. SLA Configurations
Go to SLA configuration to specify SLA timer
Parameters available for configuration:
Name
Project
Calendar
Start/Pause/Stop conditions
Multi-Cycle option
Multi-Triggers
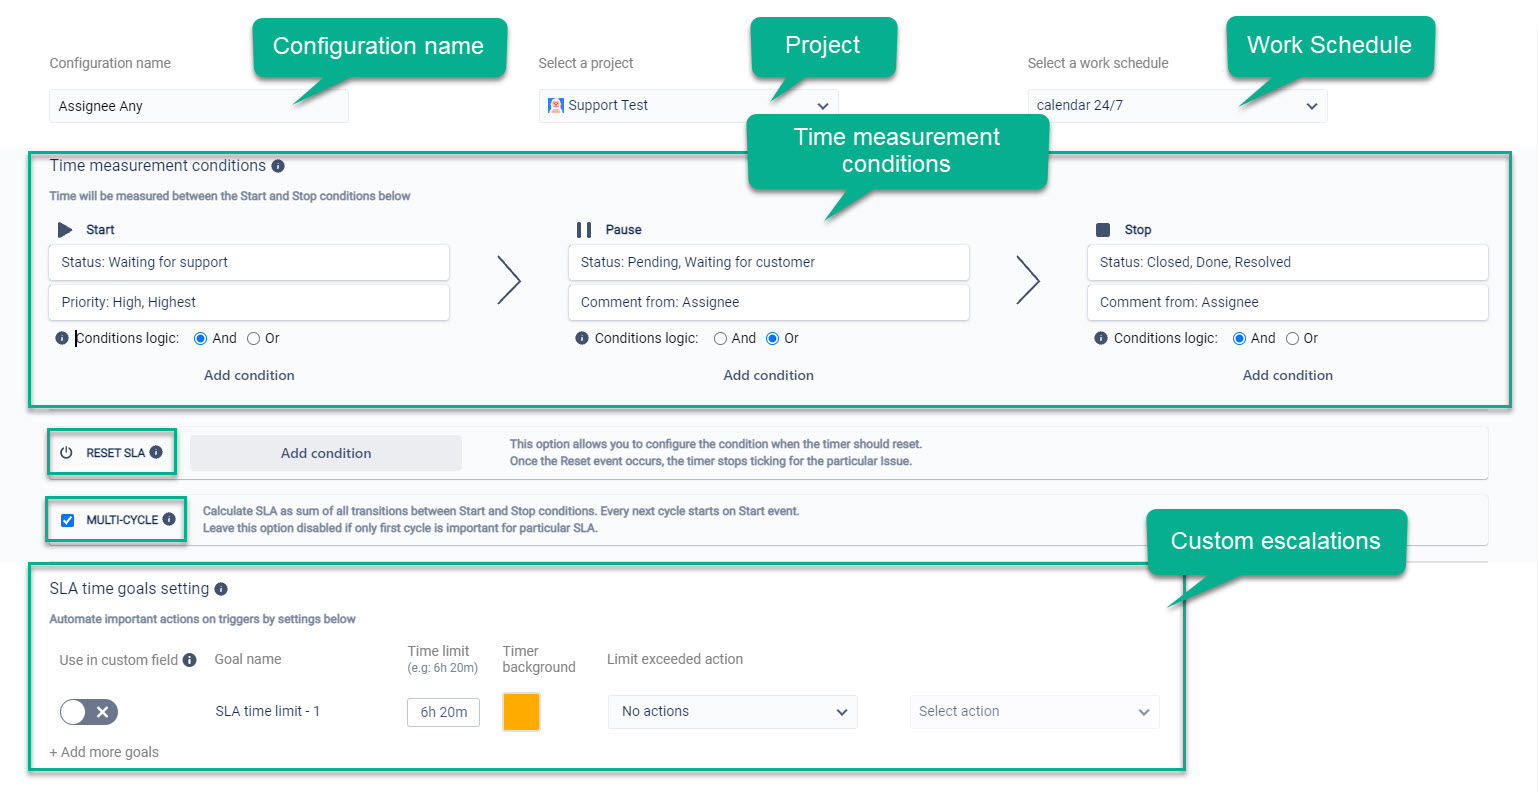
At Start/Stop/Pause conditions, you can choose standard and custom issue fields, which are using by your team for each project.
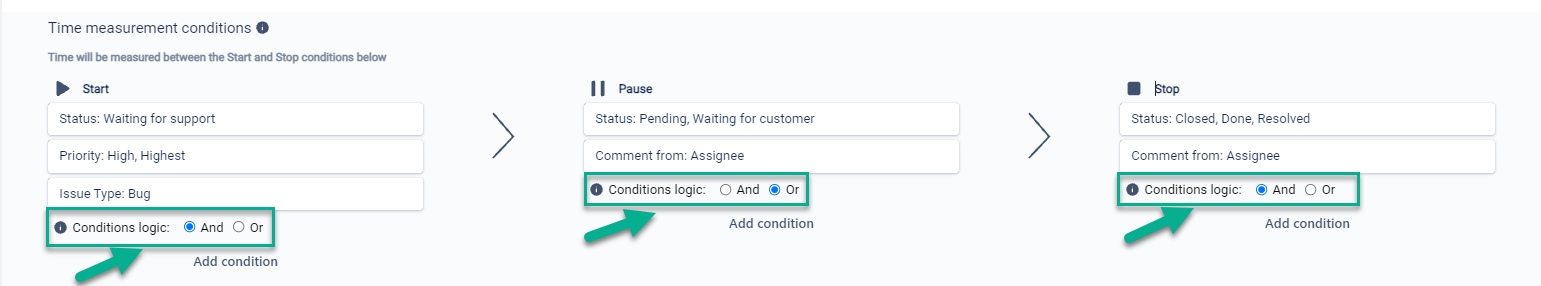
Further, you can add conditions for SLA Reset and select the Multi-Cycle option to get the cumulative sum of all cycles' duration between origin and end statuses.
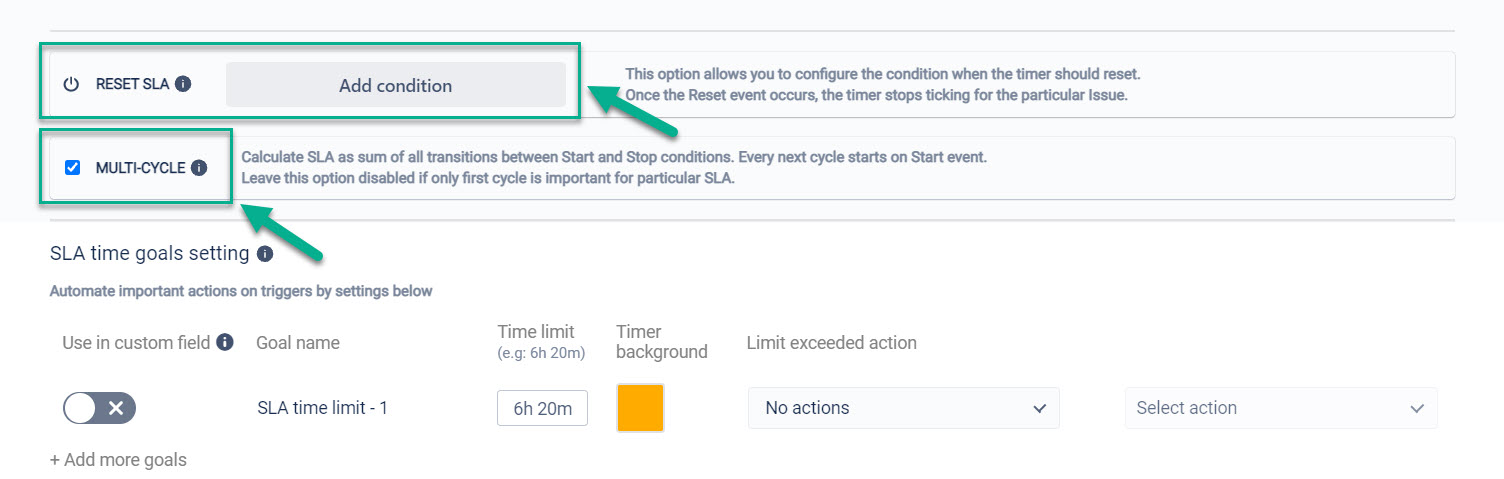
Multi-triggers let you set a time limit for each SLA configuration and choose the Automate action for exceeded issues:
notification
changing reporter
changing priority
changing status
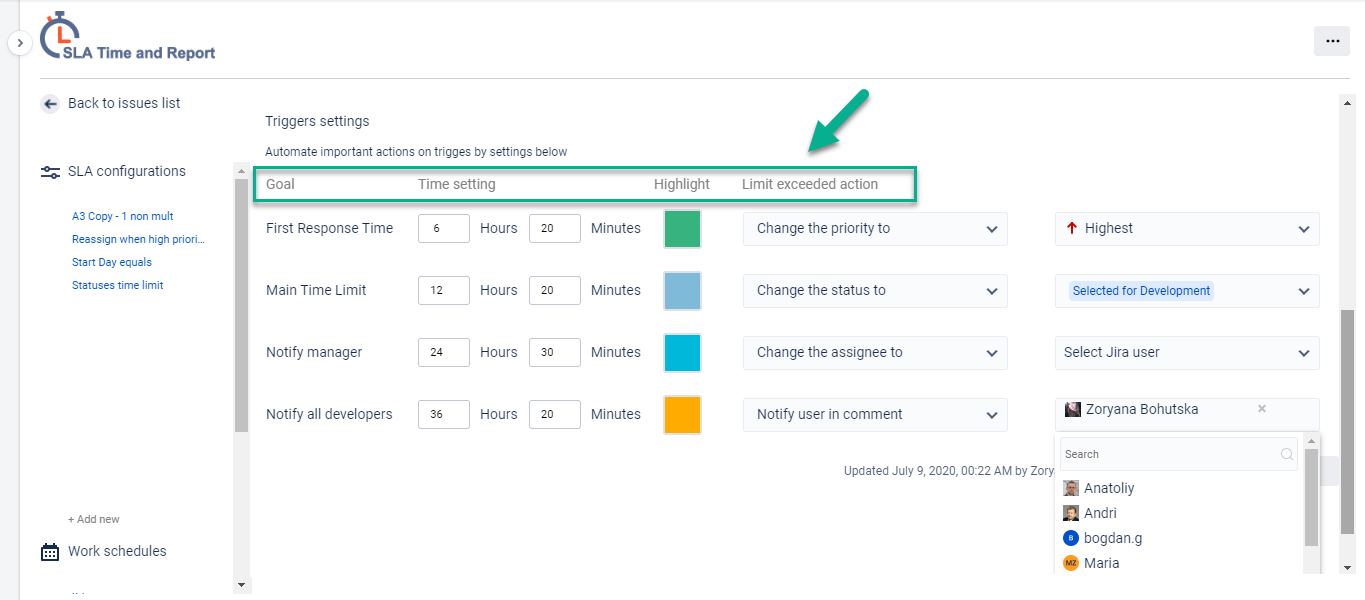
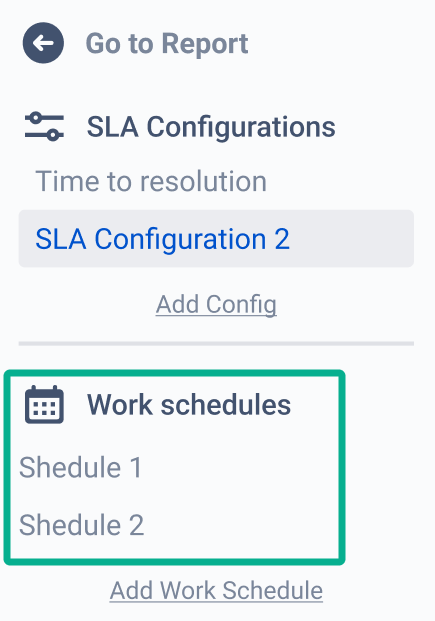
Also, on the left, you can see a list of SLAs and Work schedules, configured before. You can add the new ones, copy or delete them. Read more about how to set Work schedules here.
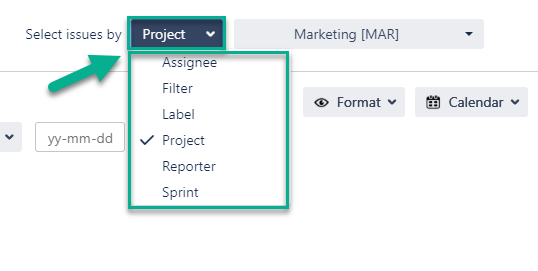
3. Report generation
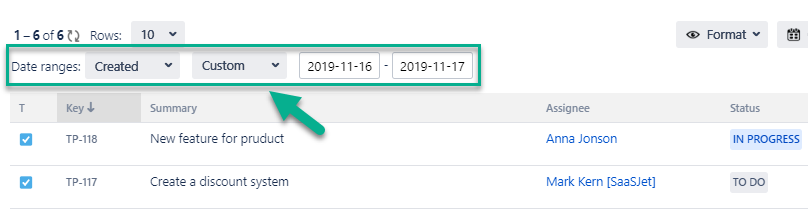
You can filter the data by Assignee, Filter, Label, Project, Reporter or Sprint.
Use the functionality of Date ranges to customize report timeframes.
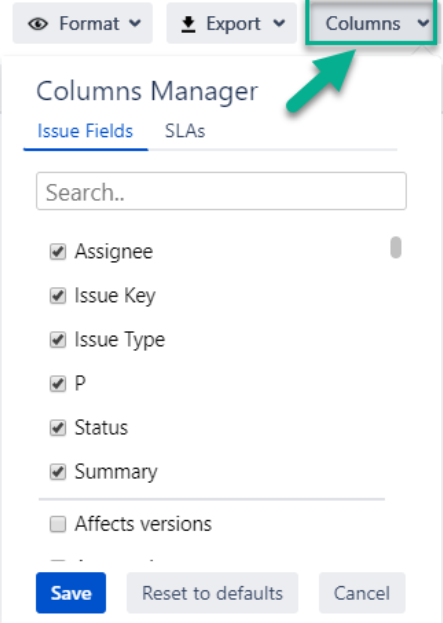
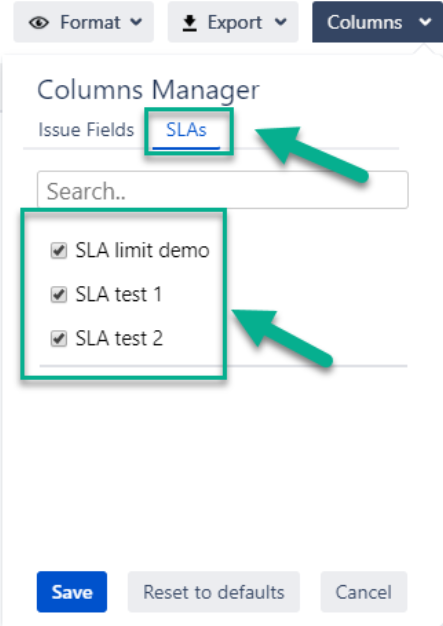
Add custom and standard fields to the grid using the "Columns" menu.
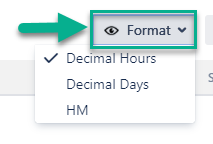
Select the time format of status duration in a "Format" field.
4. SLA Time Reports
Tablet view. According to configured before settings, you will get SLA time report. At any time you can change each of them.
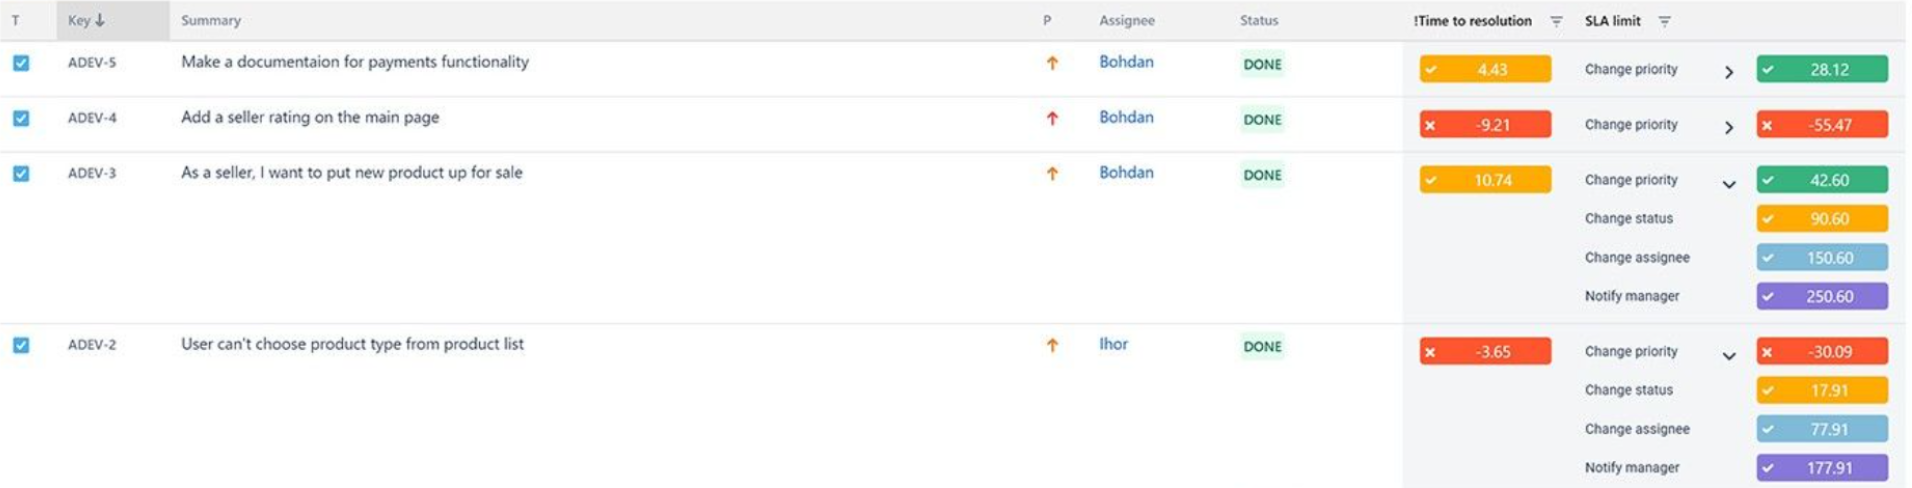
Customize the SLA report according to your SLA goals.
Additionally, you can filter the issue list according to their actual SLA status in the "Filtering" field.
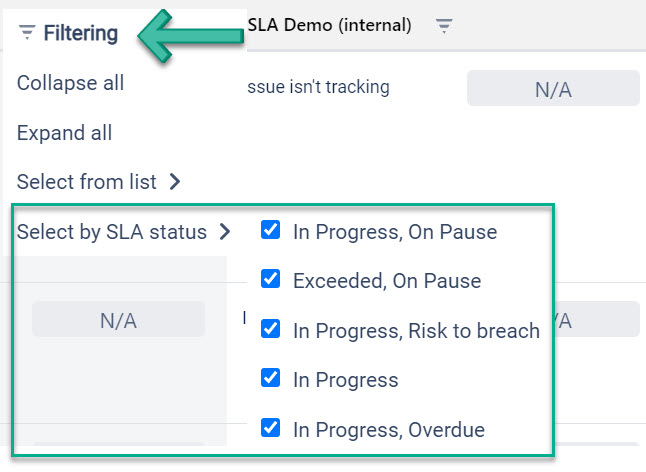
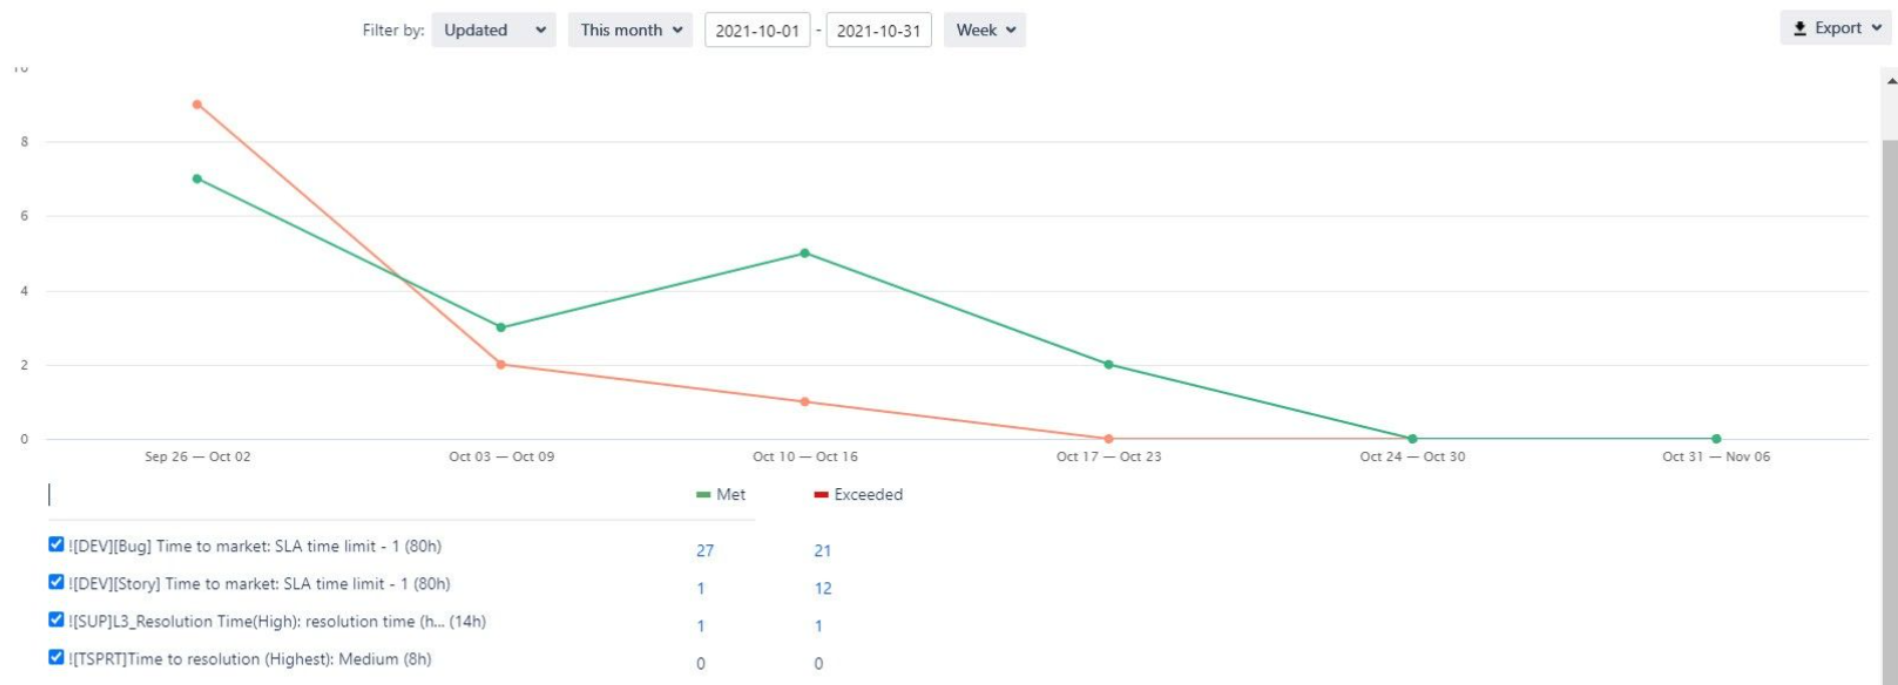
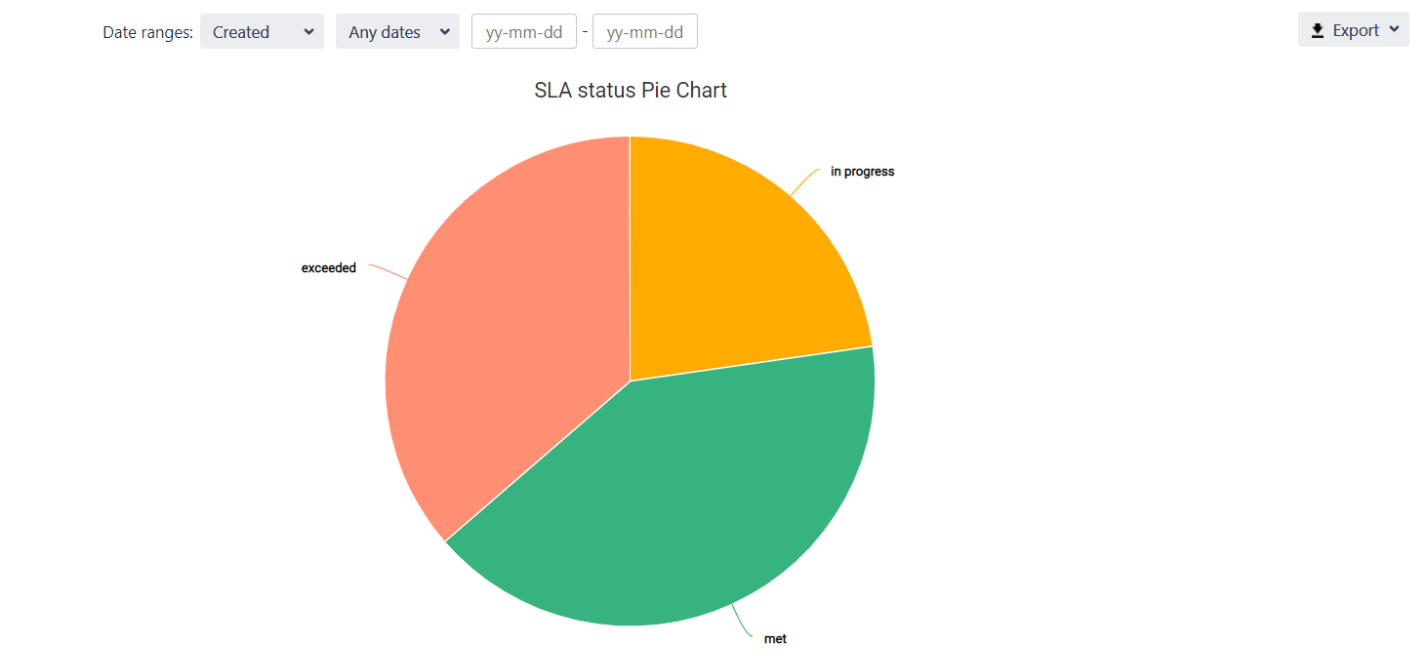
Chart View. You can also monitor SLA status data of Met/Exceeded and In progress issues in a Graph view
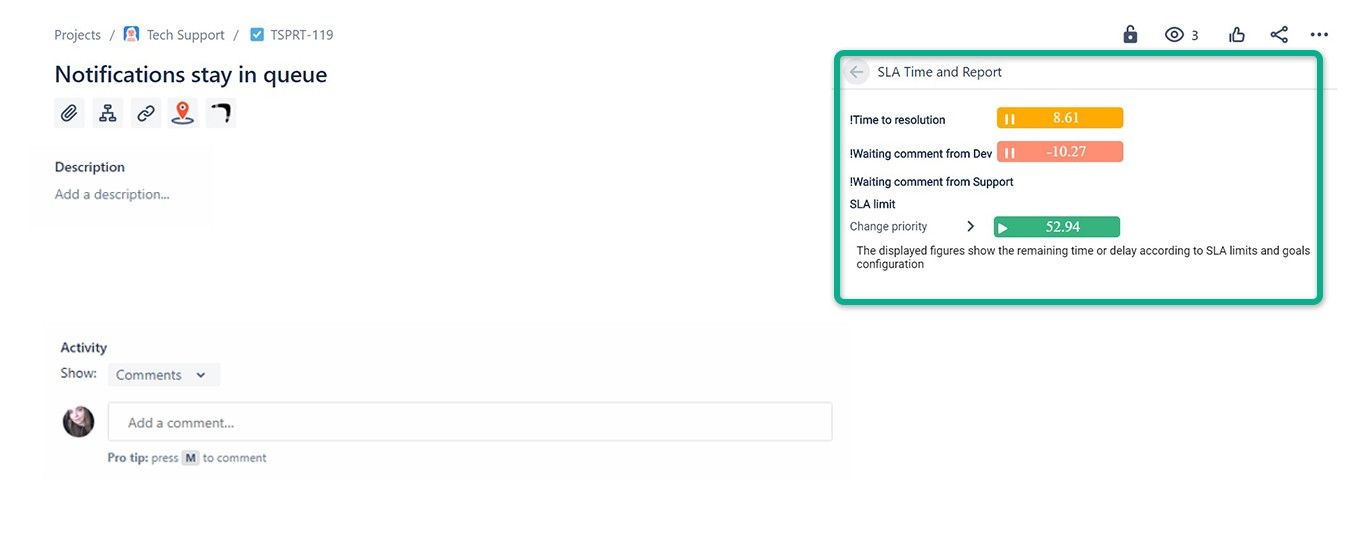
You can view time to SLA at each issue panel - just click on the button “Open SLA Time and Report”
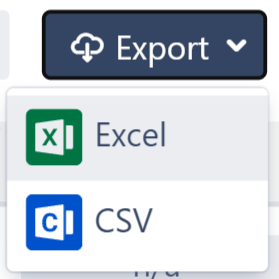
5. Data Export
Export SLA data as XLSX or CSV file SLA report and analyze it using such tools as Excel or Google Spreadsheets.
Please note: in order to extract the data for analysis, please choose one of the Decimal time formats. It will enable you to perform calculations on the exported data and build charts.
Support
If you need any help or have questions, please contact us through SaaSJet Support or via email support@saasjet.atlassian.net
Also, you can choose Documentation, Request a Feature, Report a Bug and Submit support ticket in the configuration menu at the application.
Haven't used this add-on yet, then try it now!