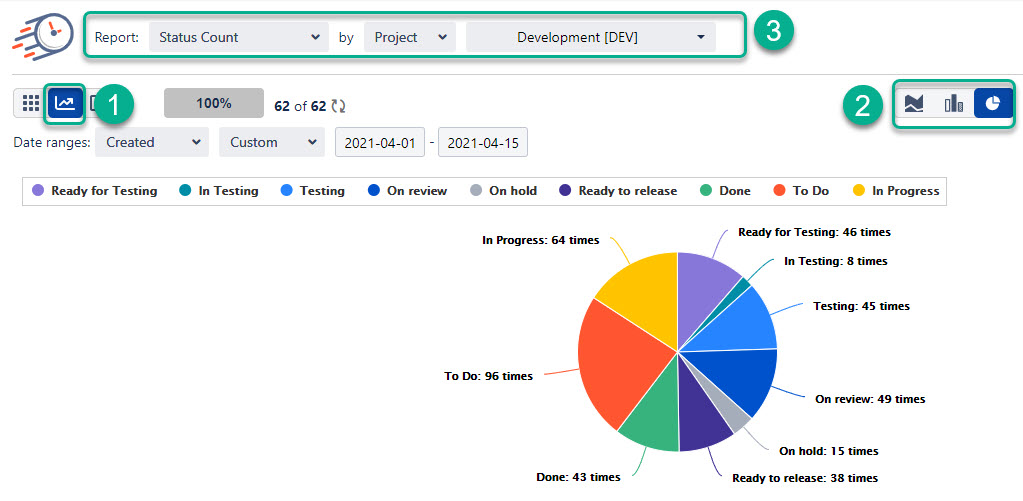
You can overview the number of times an issue has been in each status with the “Status Count” report.
Follow these steps to configure:
Switch to the graph view.
Choose the Area, Bar, or Pie Chart Type.
Select a “Status Count” report and project you need.
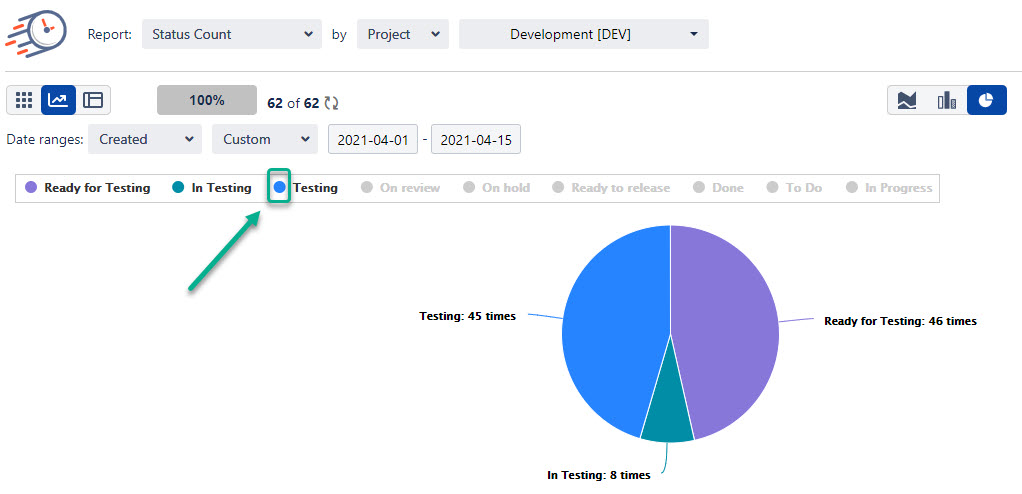
If you want to get the numbers for some status only, uncheck the unnecessary ones by tapping the colored circles.
That’s it! Now, you can create a graph to show how many times an issue was in a specific status.
If you need help or want to ask questions, please contact SaaSJet Support or email us at support@saasjet.atlassian.net
Haven't used this add-on yet? Try it now! >>>

