The Pivot Table View allows you to use such functions for reports analysis:
Monitor time for any issue fields, any combination of issue attributes (e.g: assignee time per status, time in status per assignee, compare status time for the whole team);
Manipulate data by math functions (Average, Min/Max, Median, Count, Sum, etc);
Represent data in numerical or %, etc;
Highlight cells using Conditional formatting;
Sorting and Filtering;
Three types of Layouts;
Export.
Also, you can view Uses Cases to learn in which cases you can use the Pivot Table function.
To get the Pivot Table you just need to tap on its icon in the left upper corner.
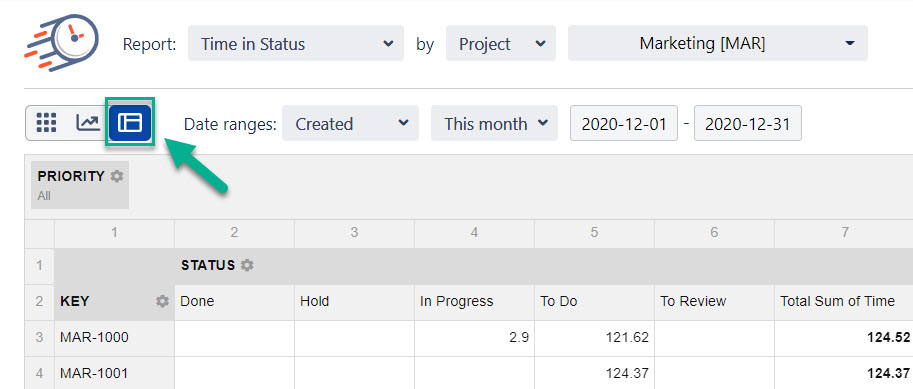
As a result, you will get all types of Time in Status for Jira Cloud reports data with Pivot Table functions.
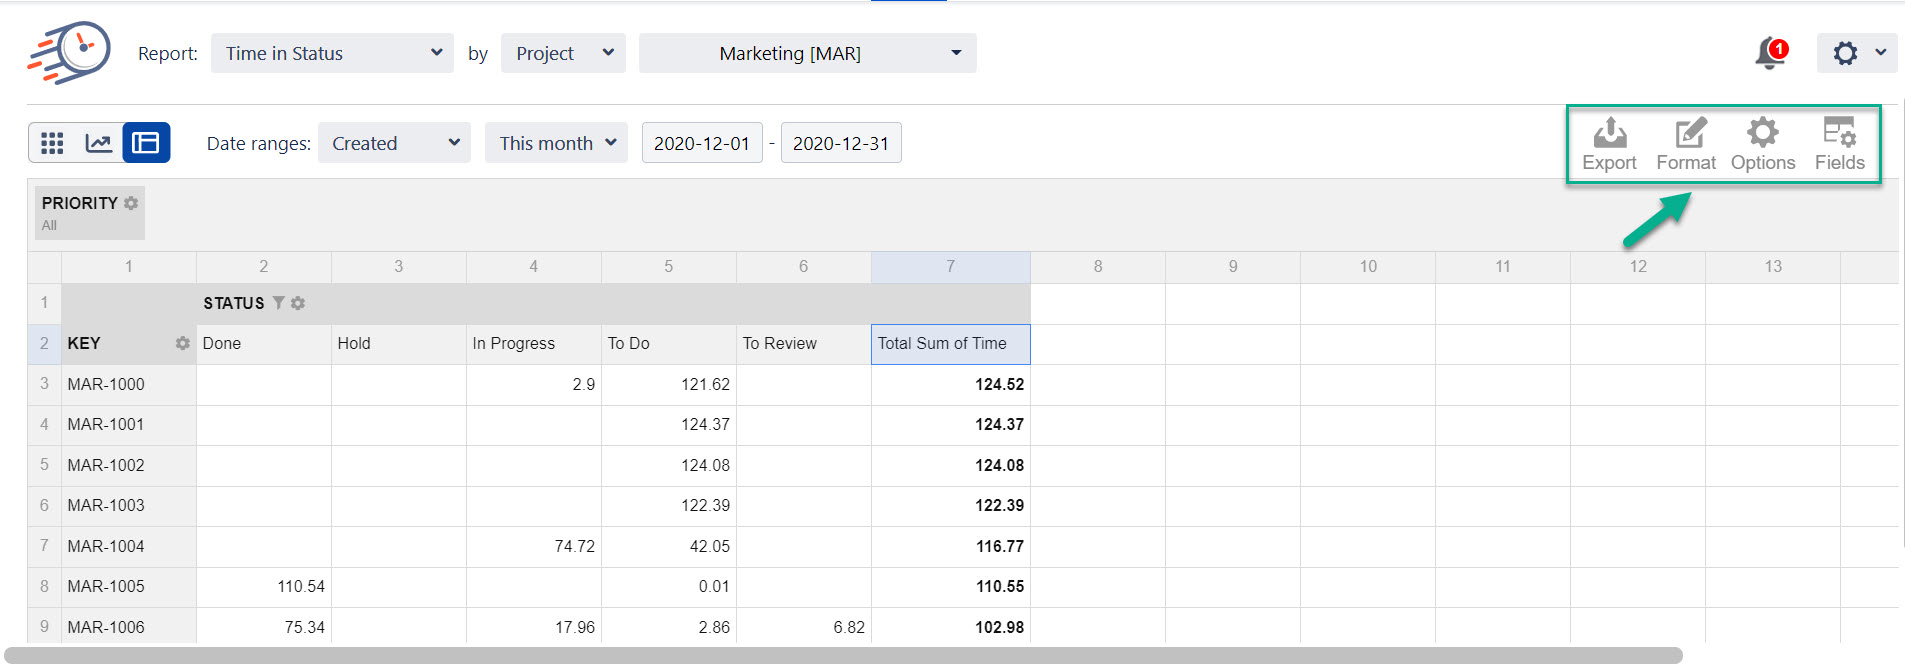
The main features of this report view are Fields, Options, Format, and Export.
Find more details in sections:
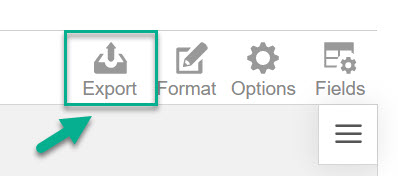
Export
You can print and export your custom configured Pivot table with Time in Status for Jira Cloud data to PDF or Excel formats.
If you need help or want to ask questions, please contact SaaSJet Support or email us at support@saasjet.atlassian.net
Haven't used this add-on yet? Try it now! >>>