1. Customization data about SLA timers
After proper settings in the SLA Configuration menu, click the “Save” button and go to the report or the main page (by clicking the SLA time and report logo) and the results will be displayed on the grid.
The SLA report contains columns with information about issues:
Type, Key, Summary - are constant;
Assignee, Status, Time to SLA, etc. - can be changed in the "Columns" menu);
a column with SLA Timer data of every issue.
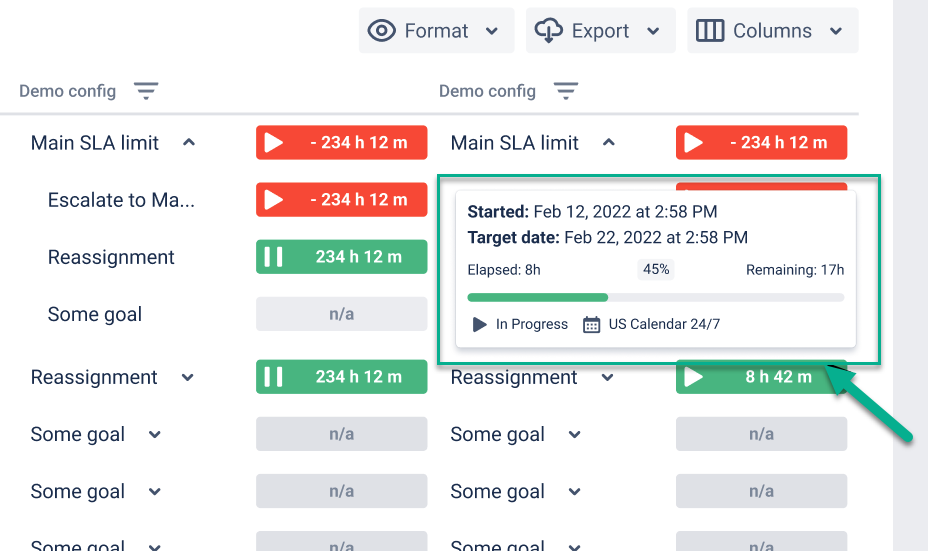
On the SLA timer, you can also monitor how much time is left until the SLA goal will be exceeded. Tickets with exceeded timers have a red color. Before the issue meets the time goals or after it is met a goal - green.
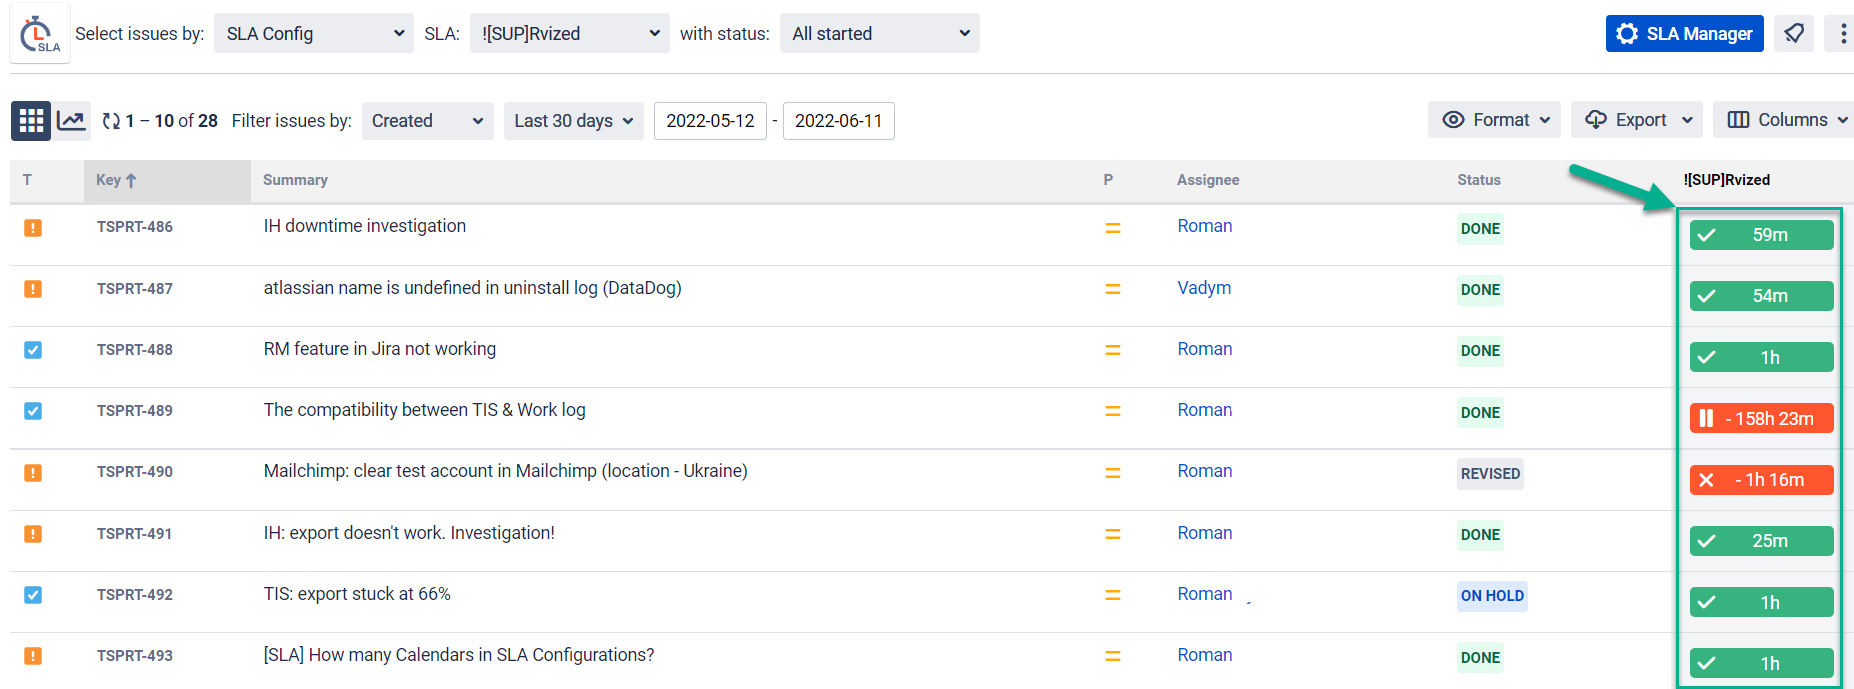
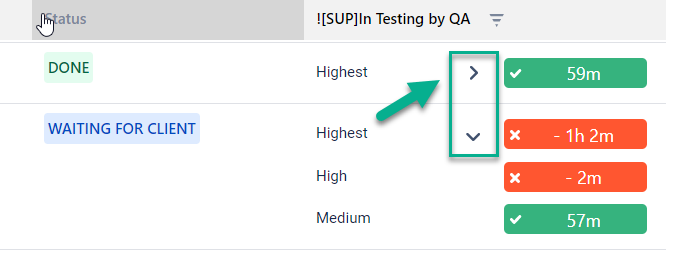
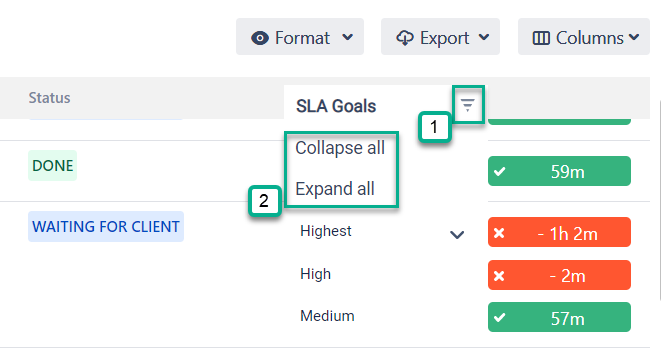
If an issue has more than one SLA goal for the SLA timer, you can see the drop-down button. Click it and get a list with all the SLA timers for one ticket.
Hover your mouse over the title of the SLA Config column and view the detailed information about its settings.
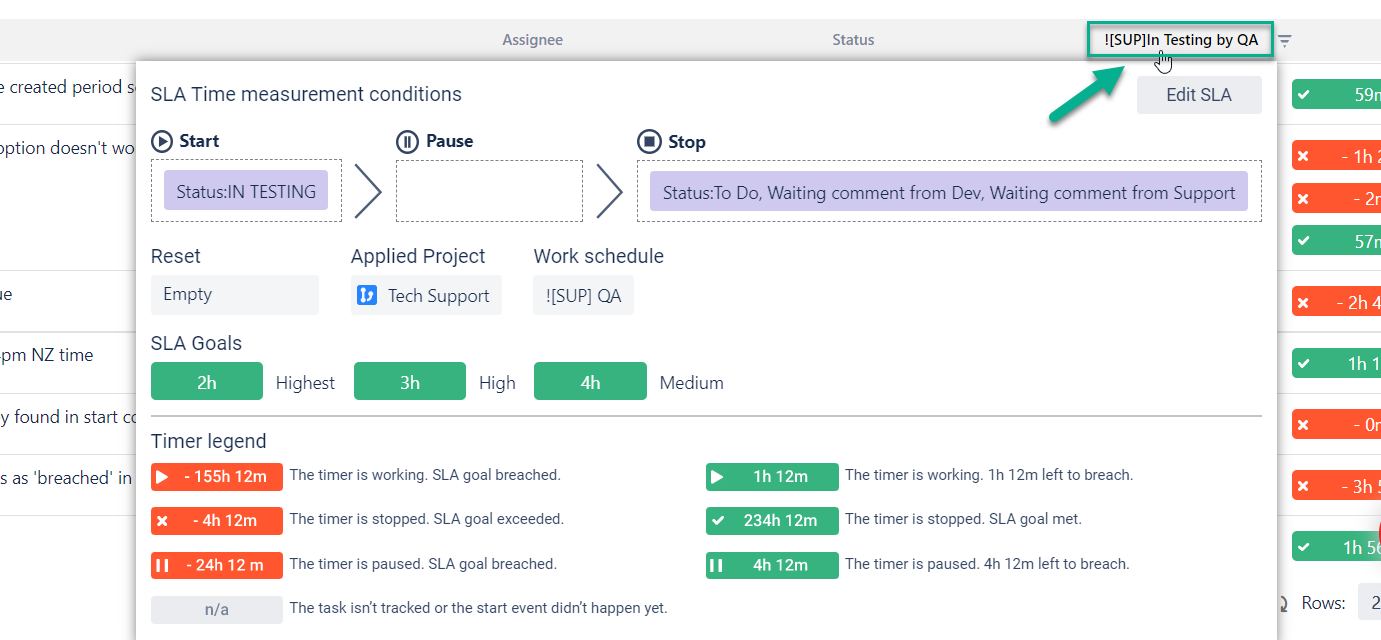
Also, you can see % of completion SLA to the target date, just go to the table view reports and there you will find hints with:
start and target dates;
demonstration of data on the percentage of completion SLA to the target date, elapsed time, remaining time;
SLA status;
type of the calendar used to calculate time.
2. Issue list customization
In the report grid view, you can customize the issue list by setting such points:
Issue list selection;
Date ranges;
Time Format;
Column manager.
2.1. Issue list selection
You can filter a list of issues for SLA Report using selections:
by Project, Assignee, JQL, Filter, Label, Reporter, Sprint
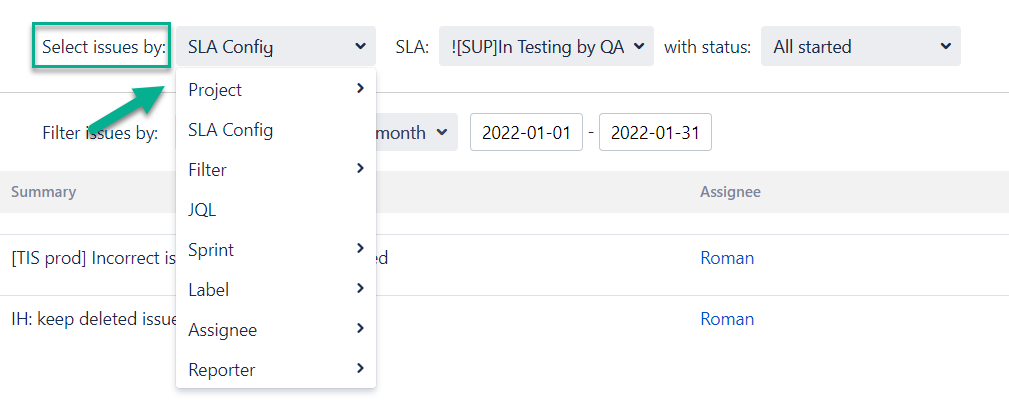
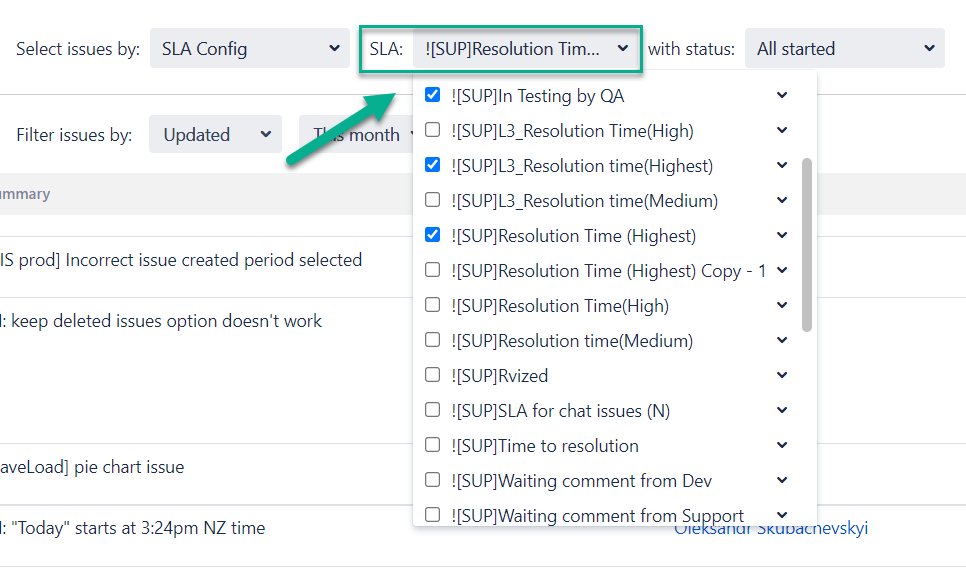
If a chosen SLA config option selection is only by SLAs, you can select the necessary SLA at the following drop-down menu.
by SLA Config
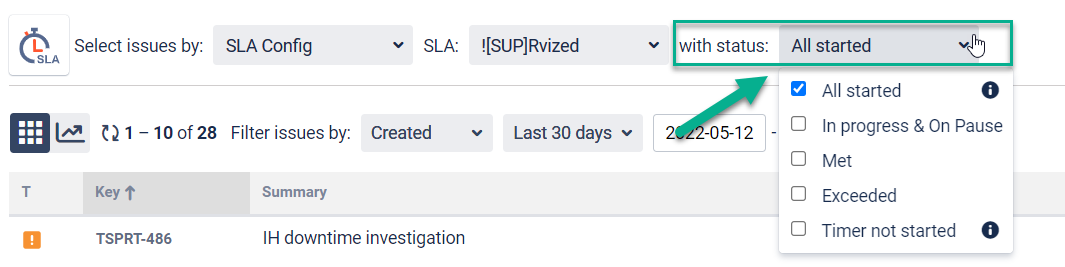
by Status of the SLA Timer: All started, In progress, On Pause, Met, Exceeded, Timer not started, etc.
2.2. Date Ranges
Use Date ranges to customize report timeframes.
By clicking the first bar, you have the ability to select 3 types of date ranges:
Created - dates of creating the issues
Updated - dates, when they were updated
Resolved - dates, when the tasks were finished
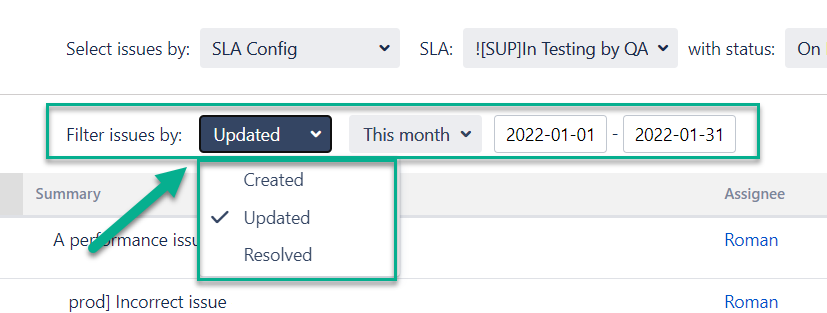
Then you can choose the period to generate the report. It can be Date ranges (yesterday, last week, this month, etc.) or you can select the custom time duration From date - To date.
2.4. Choose a Time format
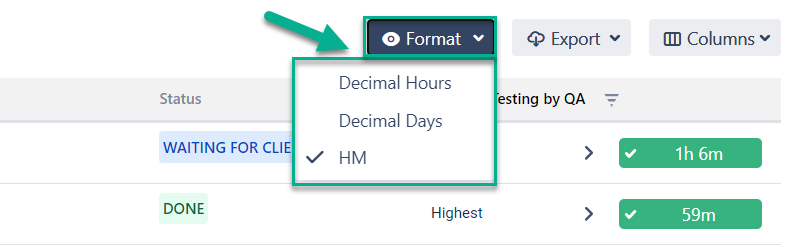
Select the time format of status duration in a "Format" field:
HM (Hours, Minutes)
Decimal Hours
Decimal Days
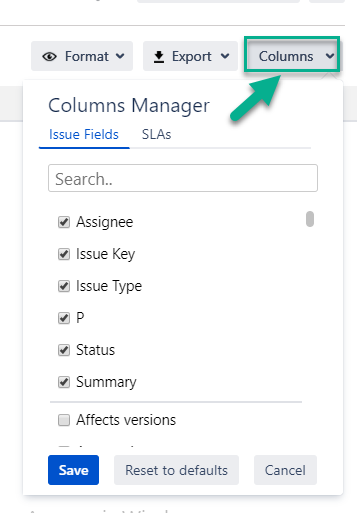
4. Column Manager
In the Column manager, you can manage the Issue Fields and configure SLAs.
Reports
Switch to Graph view to generate reports:
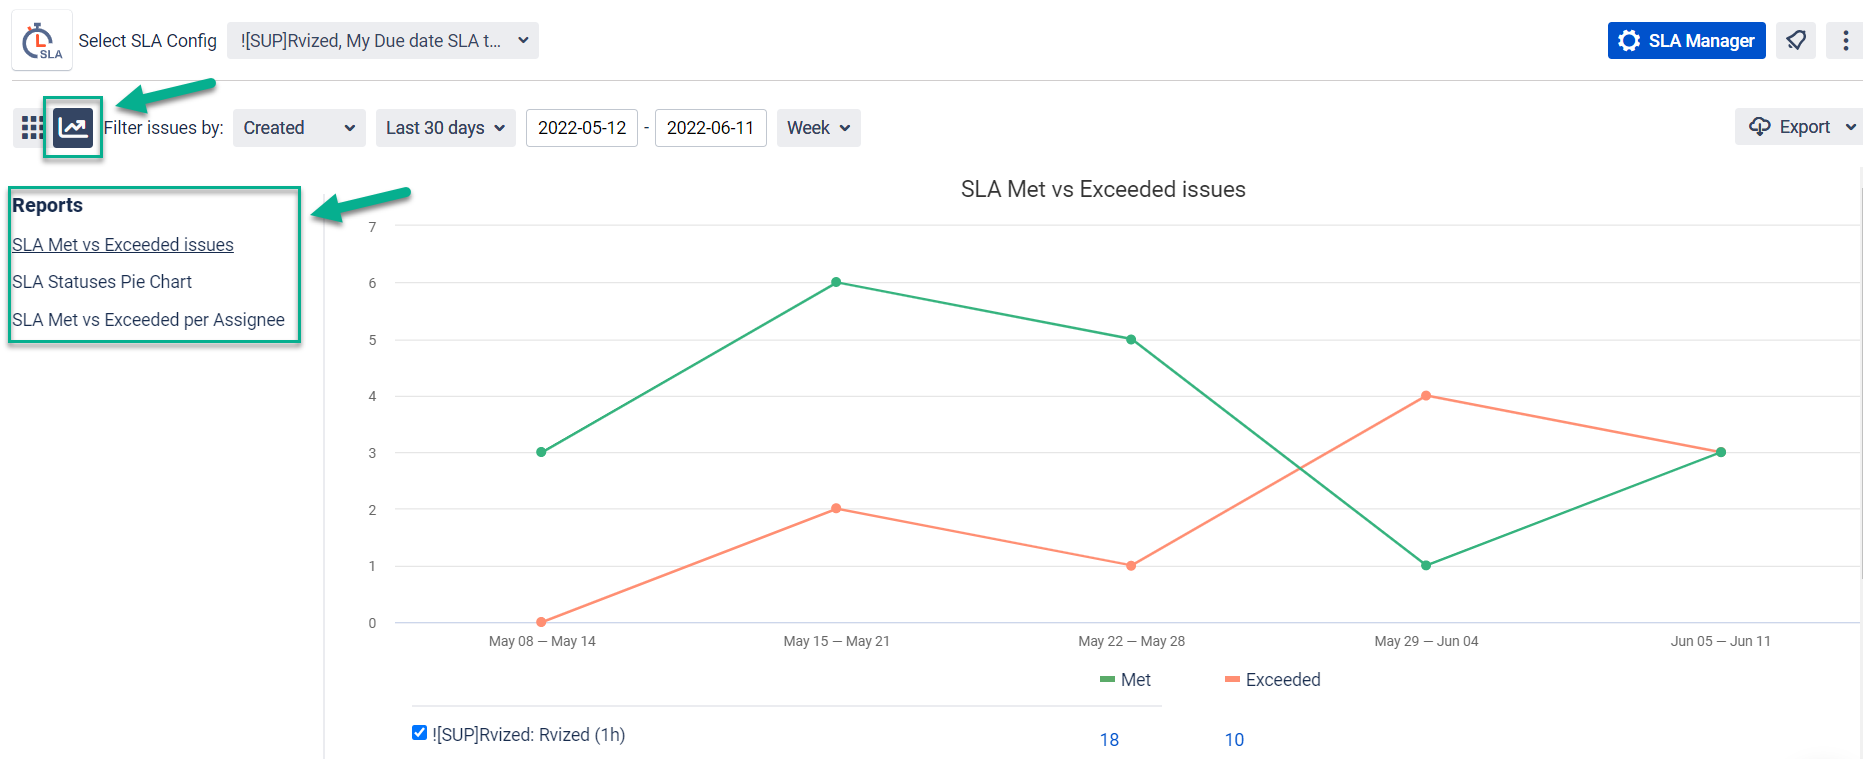
SLA Met vs Exceeded issues;
SLA Statuses Pie Chart;
SLA Met vs Exceeded per Assignee.
Related use case article: How to prepare the SLA Time and Report Gadget using native Jira Gadgets
If you need help or want to ask questions, please contact us through SaaSJet Support or via email support@saasjet.atlassian.net
Haven't used this add-on yet, then try it now!