Welcome
Learn more about all the features of Time in Status add-on.
We've prepared this short video to walk you through the updates!
| Info |
|---|
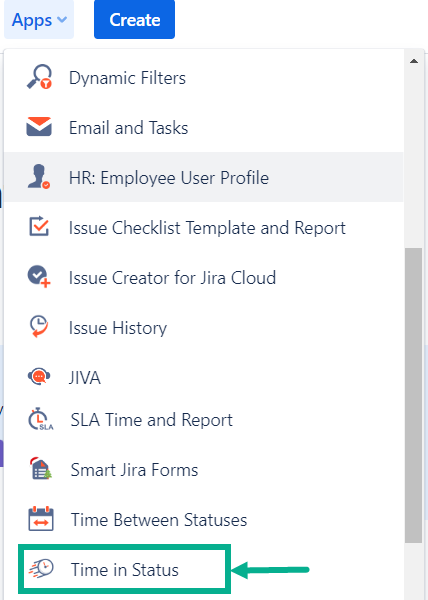
Find the installed Time in Status add-on below the Jira settings menu and click it to open. |
1. Report generation.
First, you must prepare to generate a report > Filter Jira issues by creating, updating, or resolution dates in reports. Correctly setting issue resolution is crucial for accurate data retrieval and reflection of resolved issues in reports.
Choose a report type you want to generate (see the list of reports below).
When generating the reports, you can filter data by:
Assignee,
Filter,
Label,
Project,
Reporter,
Sprint,
JQL,
Epic.
Date ranges
Use the Date ranges functionality to choose the calculation period.
If you want to generate Time in Status app report with specific date ranges, you need to set two types of dates:
Issues range– for issue list selection.
| Info |
|---|
E.g., You want to select issues that were resolved last week. |
Time range – for data calculation.
| Info |
|---|
E.g., You want to get the time only for the chosen issues and a certain period. |
*If you haven't set it, it will calculate the time data for the whole period (option Any date - selected by default).
Learn more > Issues and Time Range Periods.
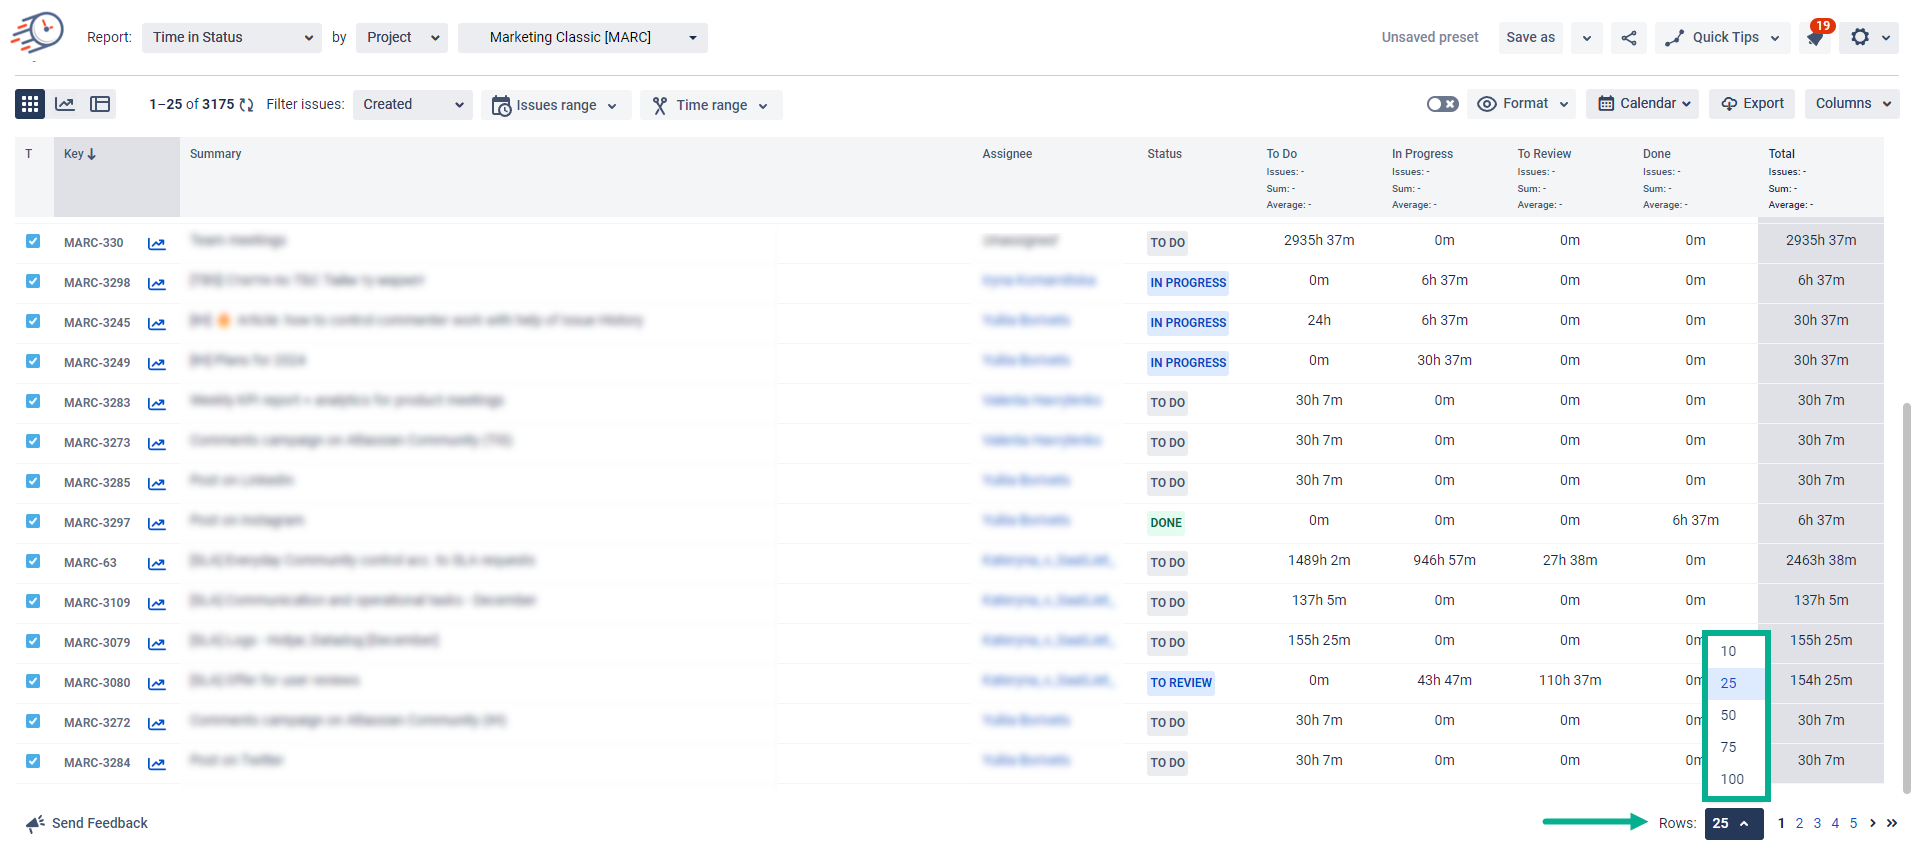
Then, choose how many rows will be displayed on the grid in the drop-down list.
Choose Calendar
You can choose a custom calendar you've added previously or a default 24/7 to generate data.
Time format
The Format option lets you select the time format how the status duration will be displayed:
Minutes
HoursMinutes
Hours:Minutes
DaysHoursMinutes
Decimal Weeks
Decimal Hours
Decimal Days
Business Decimal Weeks
Business Decimal Days
Business DaysHoursMinutes
Learn more > Time format.
2. Column Manager
In the Column manager, you can manage:
Issue Fields (fields that are displayed on the grid),
Status Groups (organize statuses in a single group),
User Groups (organize users in a single group),
Statuses (choose statuses that will be displayed on the grid).
3. Data presentation
You can display your data in 3 ways:
Open up new possibilities in analyzing the performance of your sprints:
4. Custom Fields: Effortless Time Tracking in Status
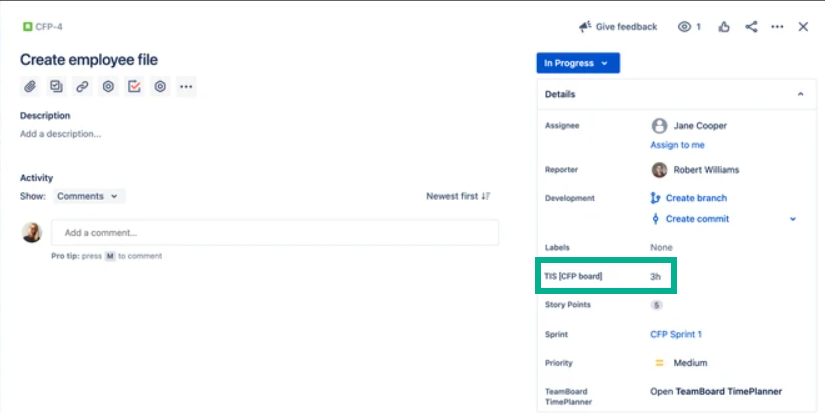
The Time in Status add-on allows you to track tasks spent in each status on your board. You can view this information directly on the board by creating a custom field.
Learn more > Custom Fields
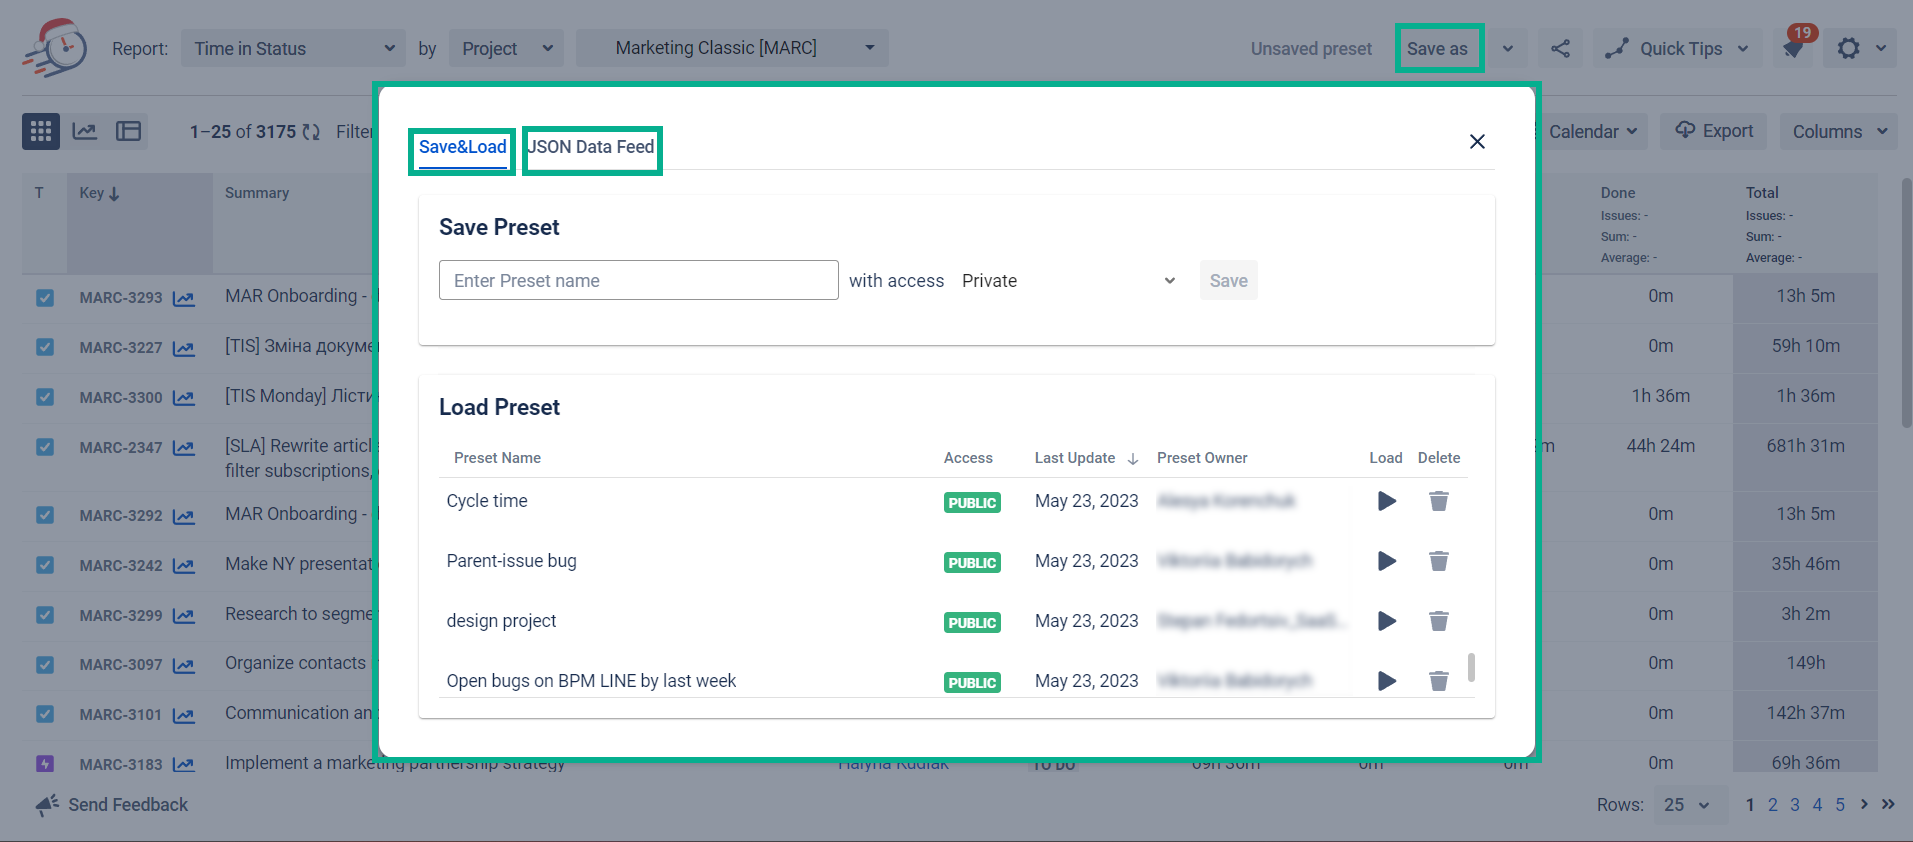
5. Save&Load and JSON Data Feed link options
These functions allow saving presets (configurations) and sharing them with third-party systems.
Learn more:
6. Data Export in Time in Status
7. Issue Widget - Time in Status
You can see both graphical and numerical data in the issue view panel. Just choose Time in status at the Activity menu in a single issue.
Here you can select one of the Report types, configure Metrics and Calendar options.
8. Dashboard gadget
All add-on reports are available in this gadget, and you can control time in status data in the Issue List or Chart View.
Check out more add-on features >>>
| Panel | ||||||||
|---|---|---|---|---|---|---|---|---|
| ||||||||
| Info |
|---|
For more details about canceling and uninstalling an app, please visit the App Subscriptions: Cancellation, Uninstalls, Refund & Renewal FAQ page. If you need any help or have questions, please contact us via SaaSJet Support or email support@saasjet.atlassian.net |
| Tip |
|---|
Haven’t worked with the add-on yet? Give it a try⬇ |


.png?version=1&modificationDate=1712653003792&cacheVersion=1&api=v2&width=945)

