...
With Time in Status
...
app you can generate 7 types of
...
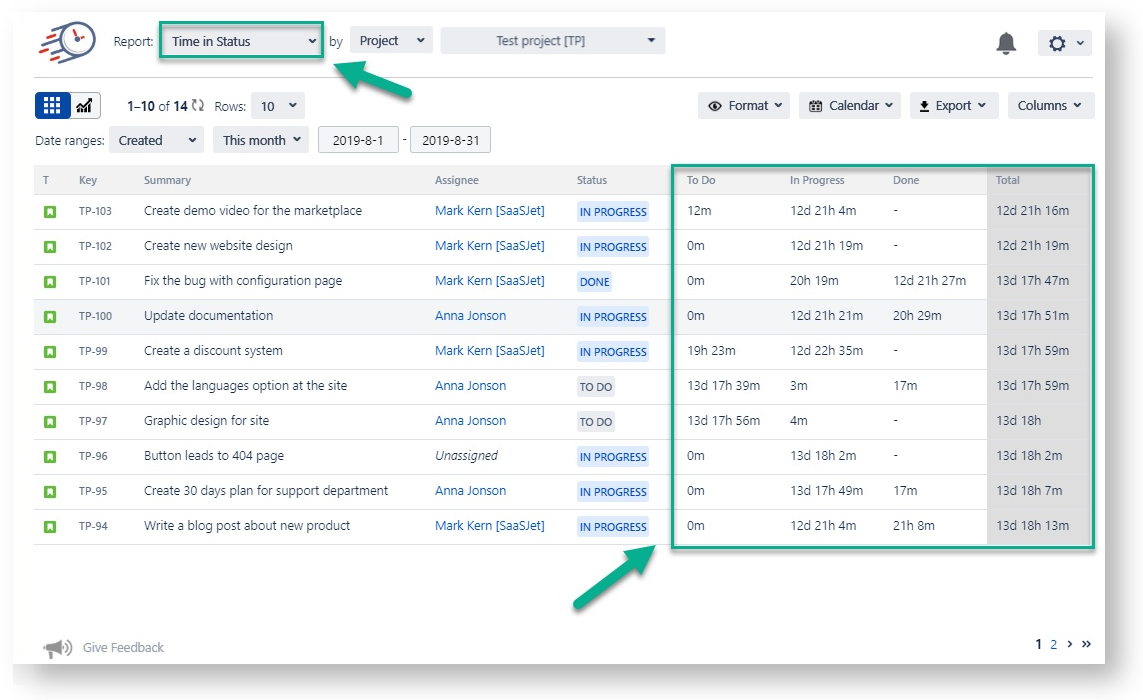
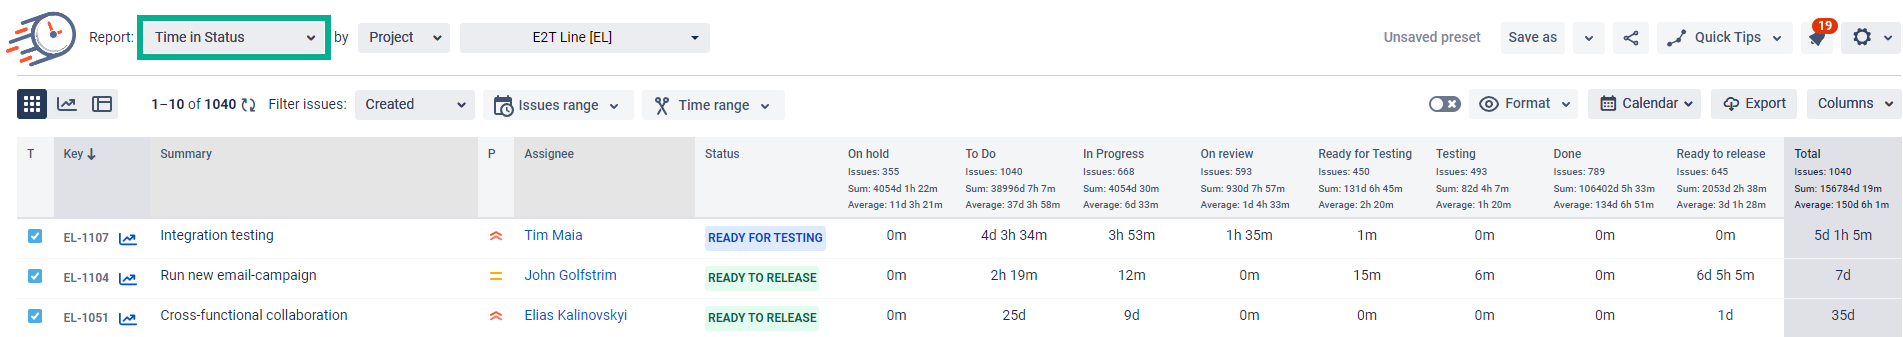
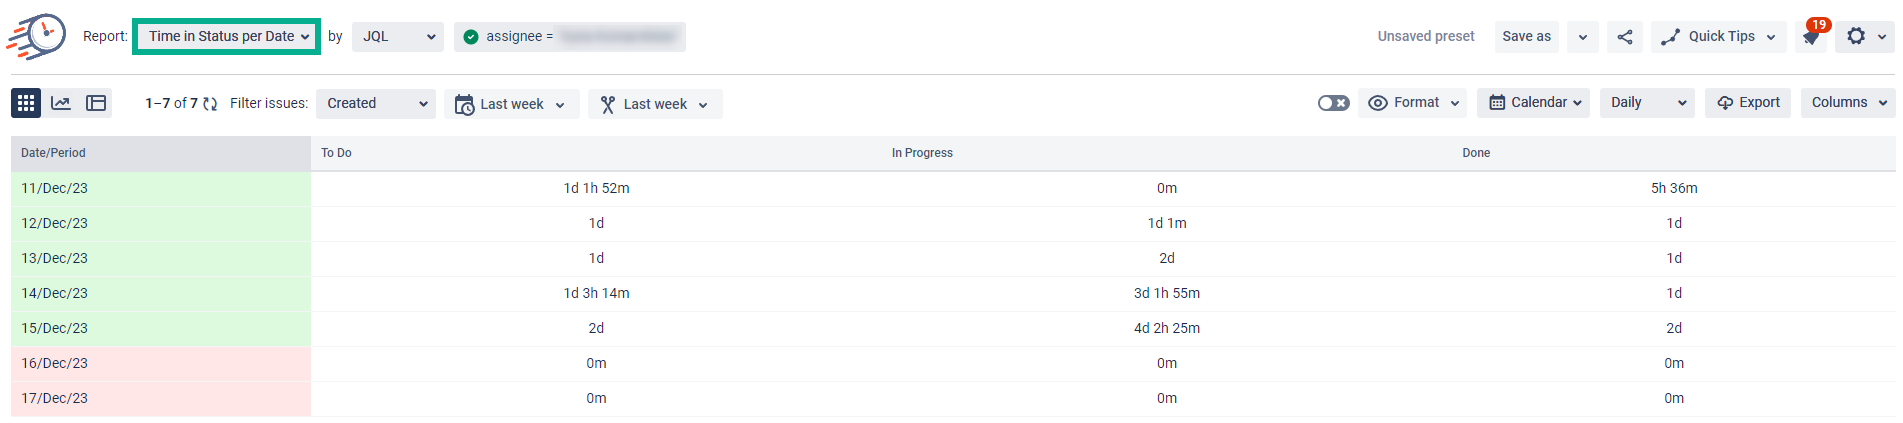
1. Time in Status
Determines for how long your issues have been staying in each status.
...
reports. All reports are available as Grid and Charts.
Time in Status report shows how long the issue has spent in each workflow status;
...
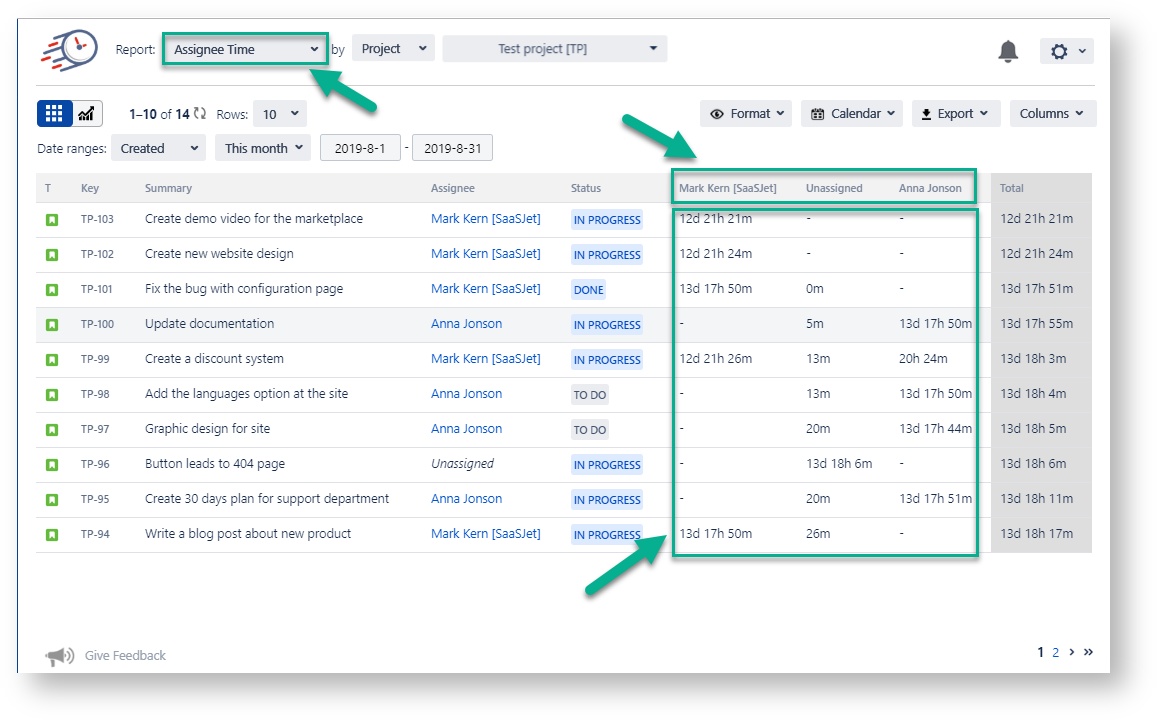
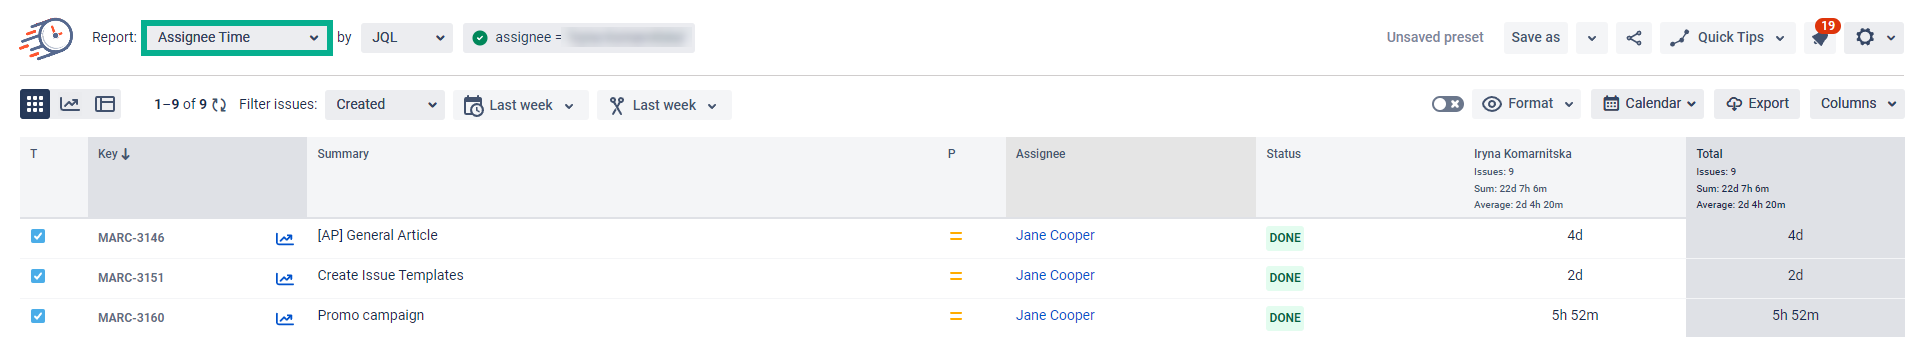
The report of the time that a particular assignee has been working on each issue.
.gif?version=1&modificationDate=1599195614402&cacheVersion=1&api=v2&height=400)
*Please, note that Status groups are not available for this report type.
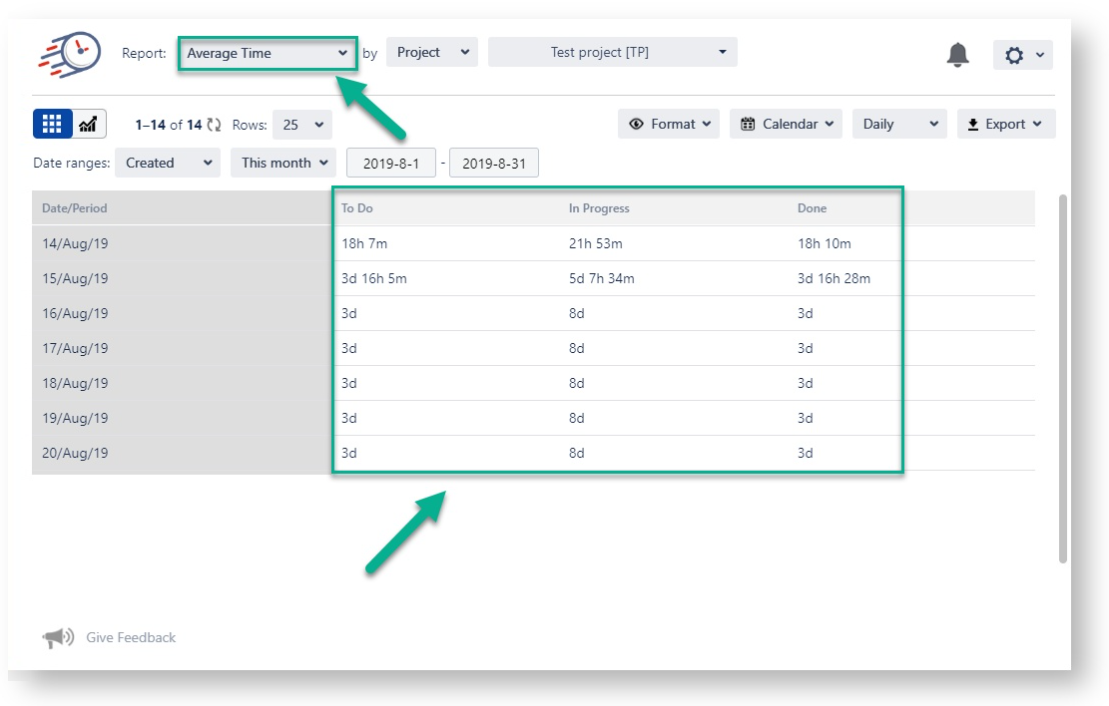
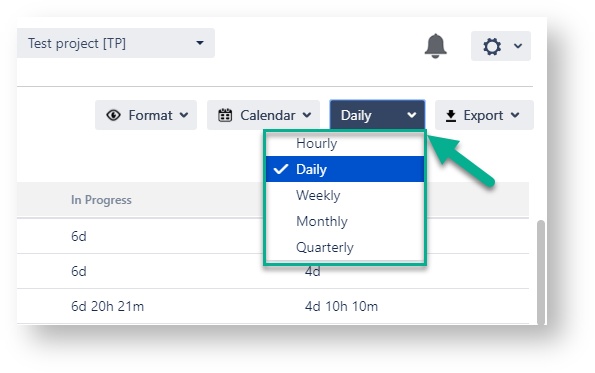
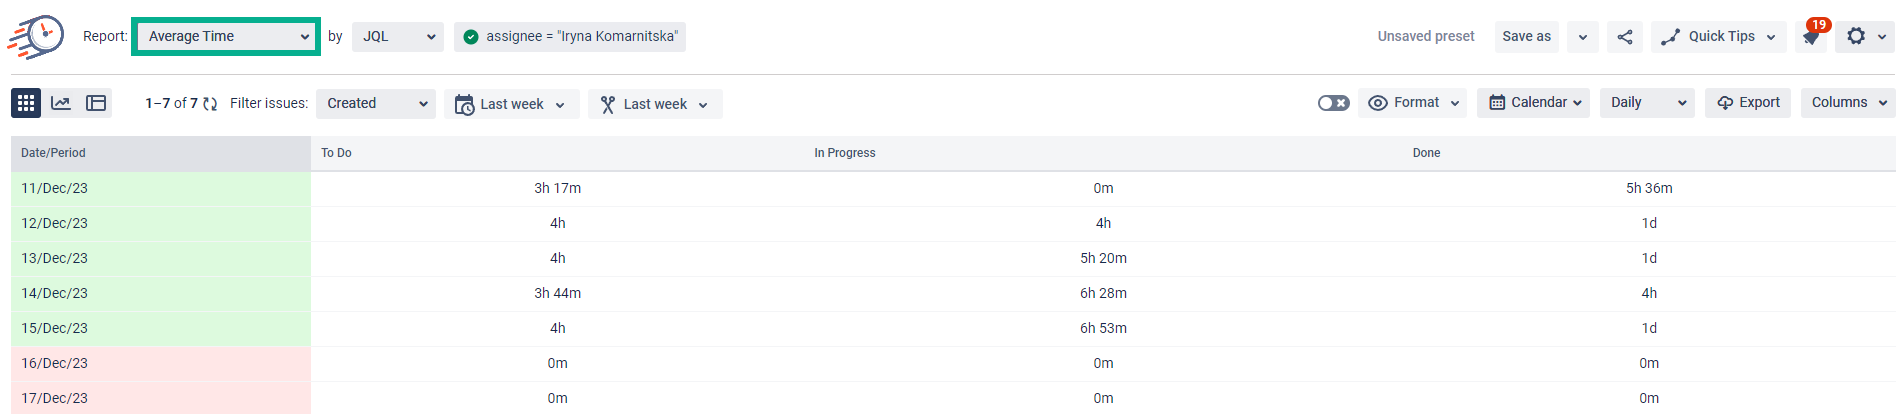
3. Average Time
A grid with average time issues has been staying in statuses during a specific period.
.gif?version=1&modificationDate=1599195547339&cacheVersion=1&api=v2&height=400)
At the grid metric select how you want the Average Time in status to be displayed: Hourly, Daily, Weekly, Monthly, or Quarterly.
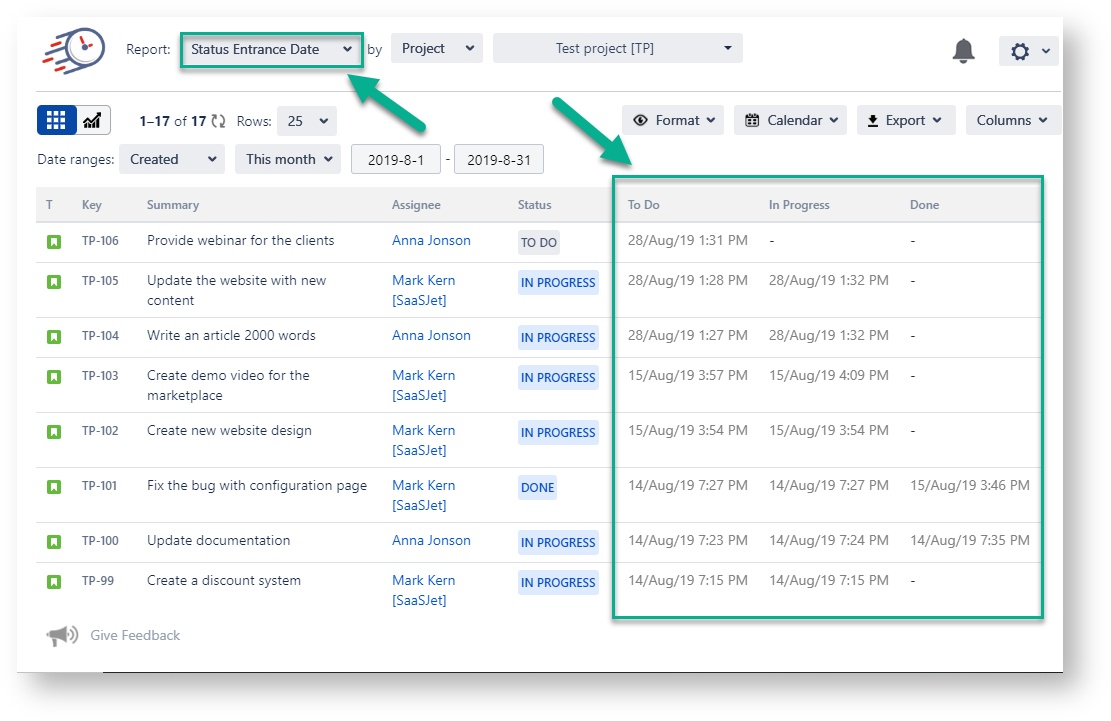
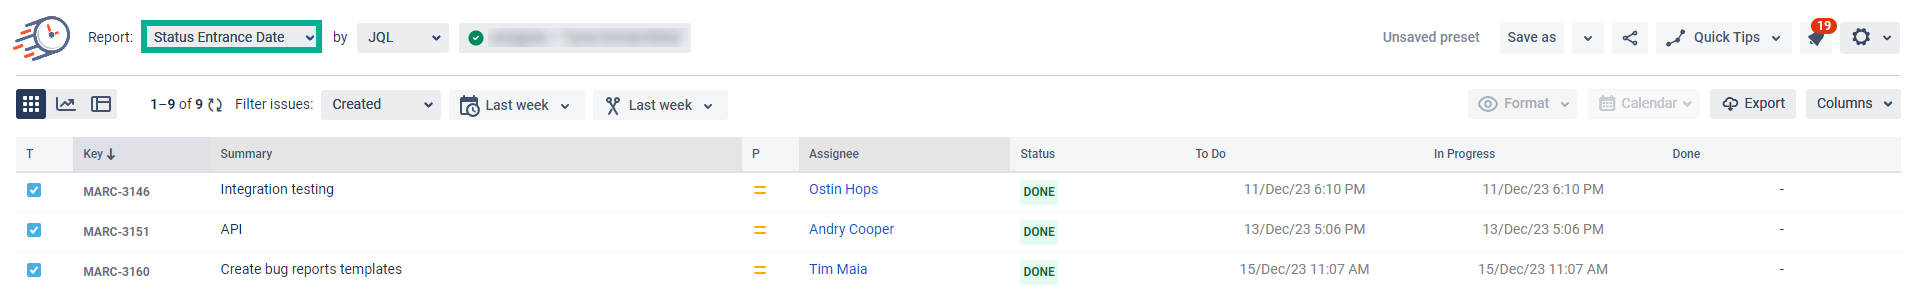
4. Status Entrance Date
...
report helps to monitor how long it takes for each team member to solve the issue;
3. Average Time report shows the average time spent in status;
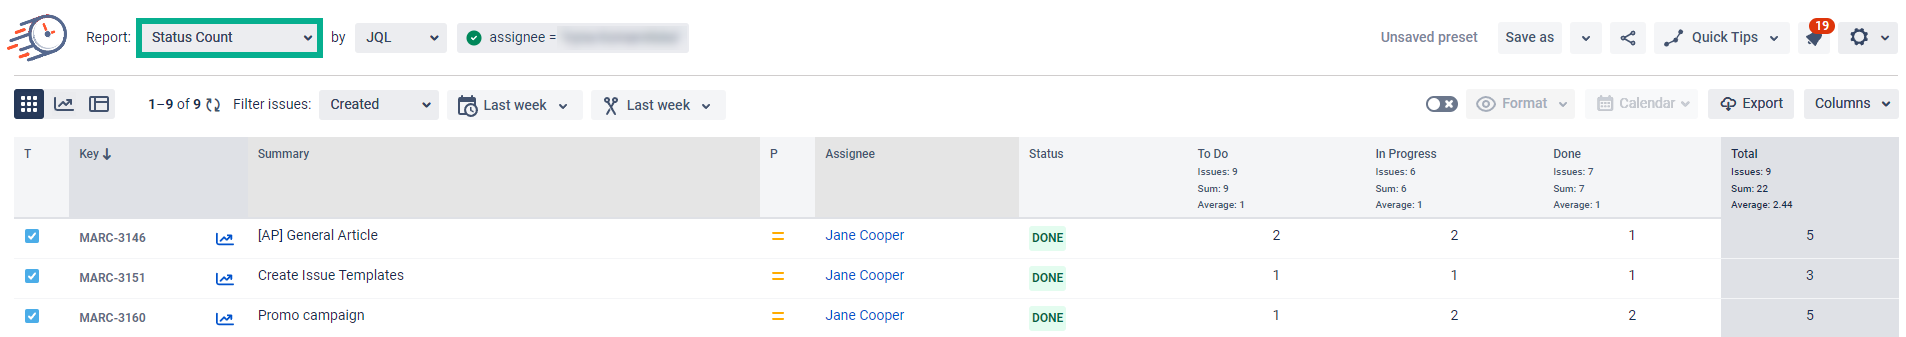
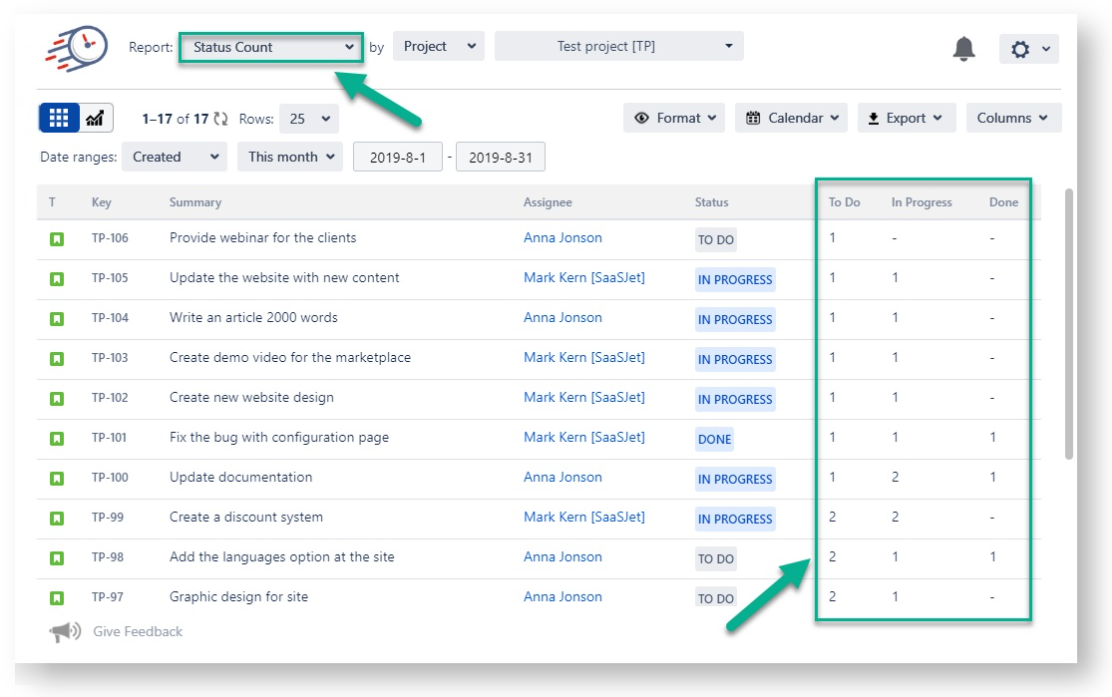
4. Status Count report displays how many times an issue has been in a particular status during the chosen period.
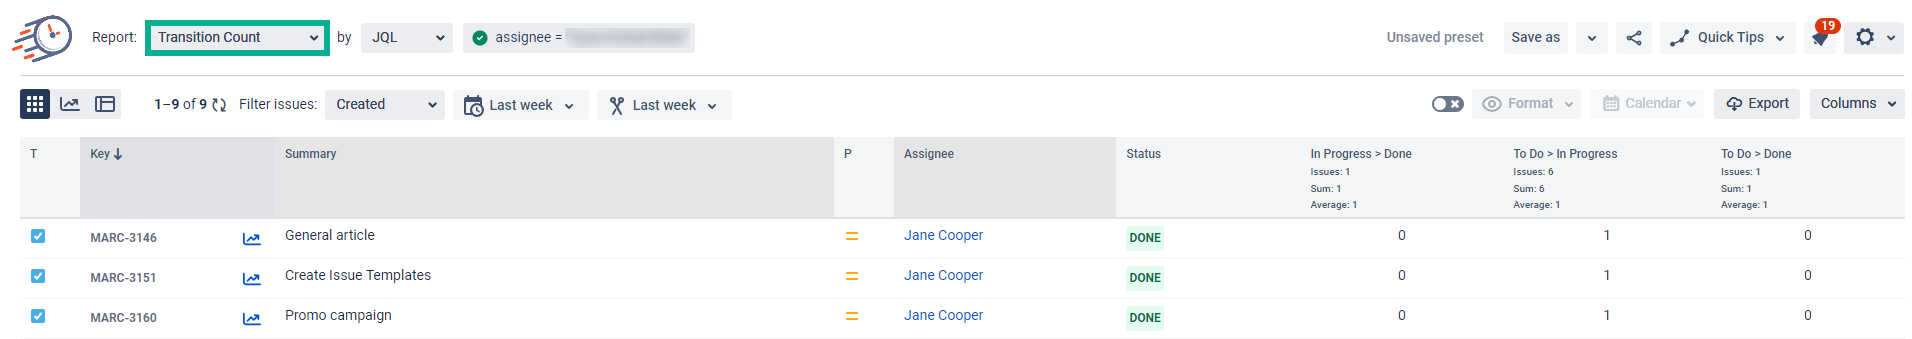
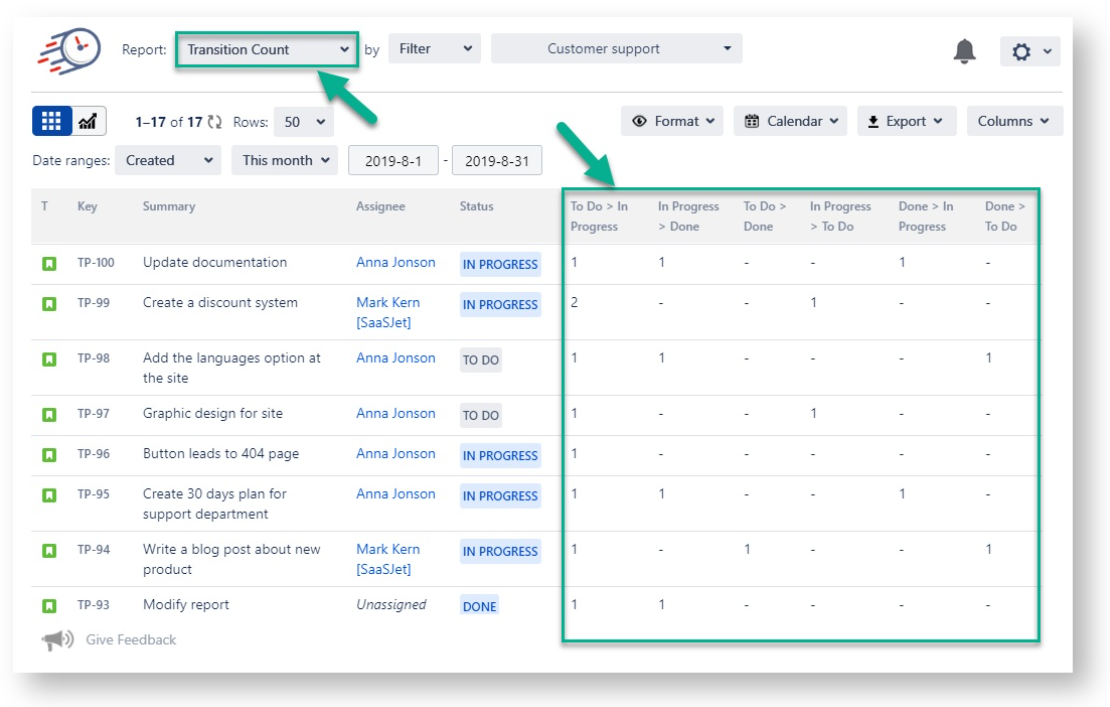
5. Transition Count report calculates how many times an issue has moved between the workflow statuses.
6. Status Entrance Date report displays the date the issue has entered each of the statuses
...
.
.gif?version=1&modificationDate=1599195801731&cacheVersion=1&api=v2&height=400)
*Please, note that Status groups are not available for this report type.
...
report sums the time
...
an issue has been
...
in
...
a particular
...
status during the chosen period.
...
.gif?version=1&modificationDate=1599195858646&cacheVersion=1&api=v2&height=400)
6. Status Count
Calculates how many times an issue has been in each status.
.gif?version=1&modificationDate=1599195895690&cacheVersion=1&api=v2&height=400)
7. Transition Count
Shows how many times an issue has moved from status to status.
![]()
*Please, note that Status groups are not available for this report type.
| Info | ||
|---|---|---|
| ||
Go to generate the report >>> |
...
| icon | false |
|---|
...
| Note |
|---|
The Summary Row option, typically located in the column header, is currently unavailable due to ongoing technical enhancements. If you require this feature, please reach out to our support team. They'll be able to activate the Summary Row specifically for your Jira instance. |
Go to generate the report >>>
| Panel | ||||||||
|---|---|---|---|---|---|---|---|---|
| ||||||||
| Info |
|---|
If you need help or want to ask questions, please contact SaaSJet Support or email us at support@saasjet.atlassian.net |
| Tip |
|---|
Haven’t worked with the add-on yet? Give it a try⬇ |