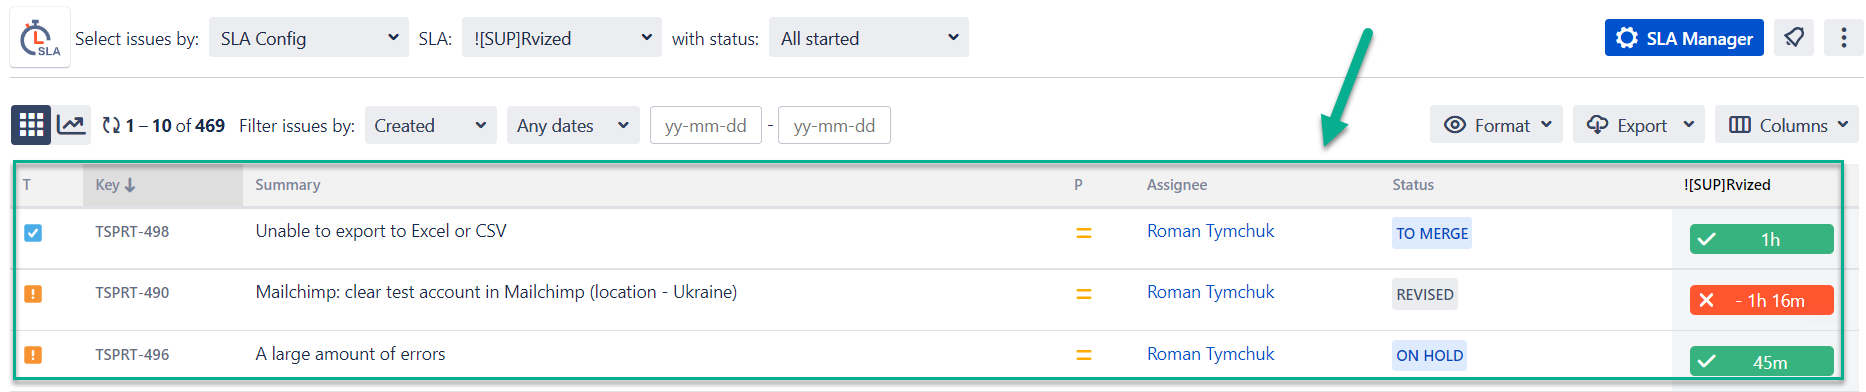
Monitor tasks fulfillment and Issues' statuses according to the data at the grid table which contains a set of data that is structured in rows and columns.
You can sort the data by Type, Key, Summary, Assignee, Status in ascending or descending order.
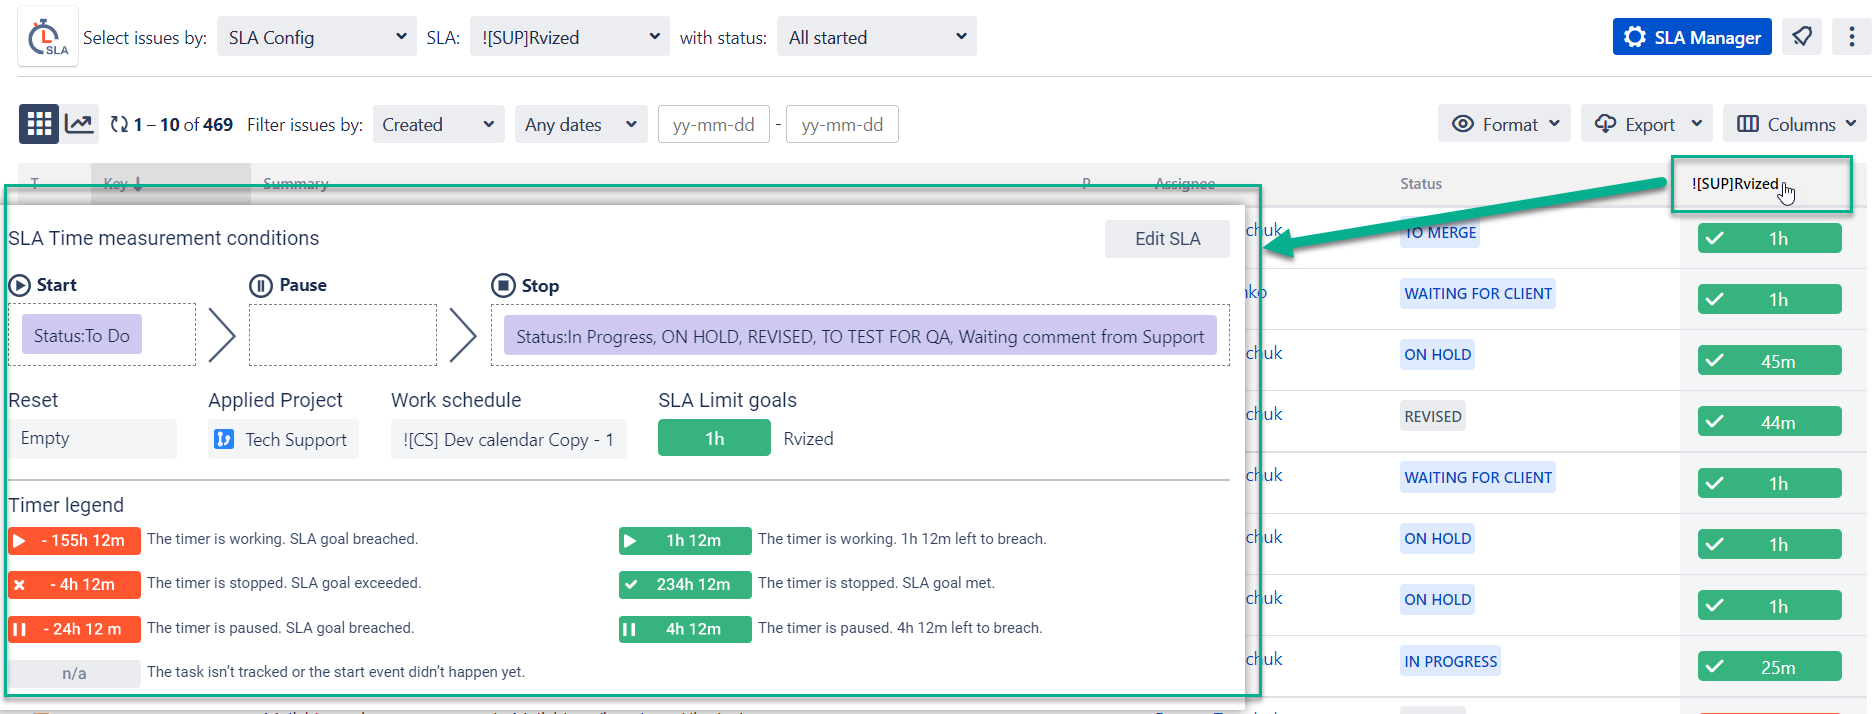
If you click the SLA Name at the right corner (at the top of the grid table), you can see detailed information about the SLA measurement conditions.
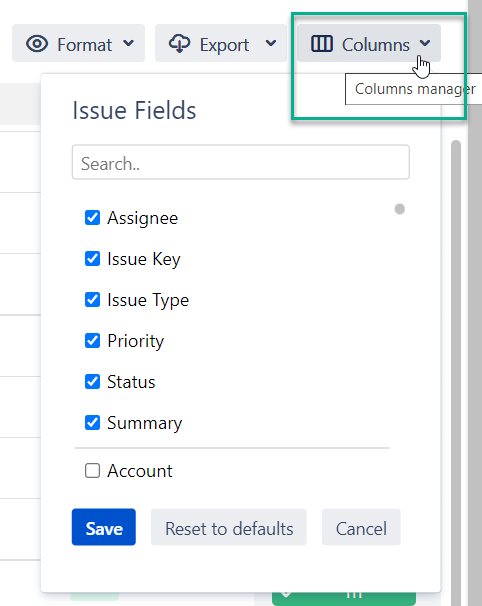
Organize columns, add new columns if needed.
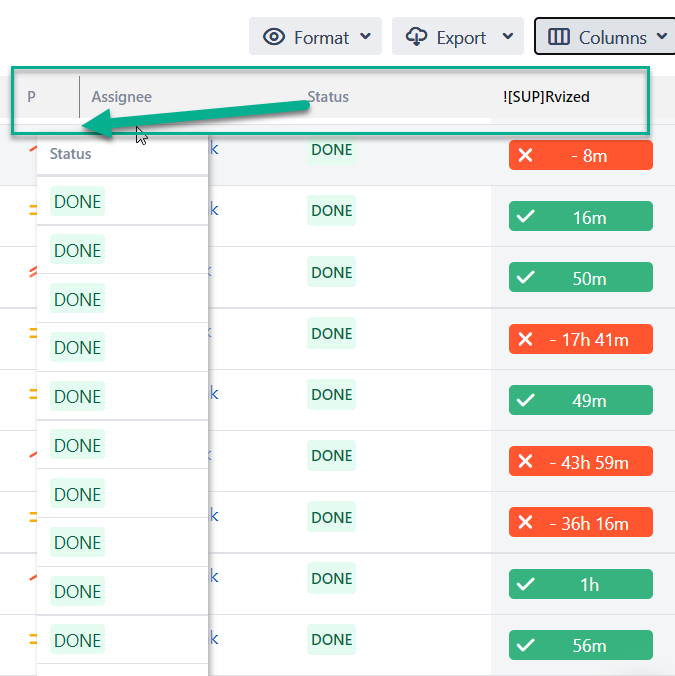
Move columns to the right/left to see data in the necessary order.
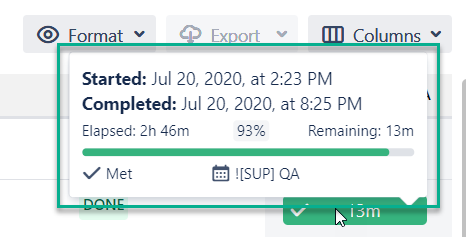
You can see Enhanced/Elapsed time hints (for SLA timers and on column hover) with:
start and target dates;
demonstration of data on the percentage of completion SLA to the target date, elapsed time, remaining time;
SLA status;
type of the calendar used to calculate time.
Also, you can prepare a report based on this data.
Related use case article: How to prepare the SLA Time and Report Gadget using native Jira Gadgets
If you need help or want to ask questions, please contact us through SaaSJet Support or via email support@saasjet.atlassian.net
Haven't used this add-on yet, then try it now!